Alertas personalizados e visualização de dados permitem que você identifique e evite rapidamente tempos de execução lentos, servidores de banco de dados que não respondem e outros problemas em seu ambiente de banco de dados.
O PRTG monitora seus bancos de dados MySQL para ajudá-lo a garantir que seus aplicativos estejam sempre disponíveis e possam ser acessados o mais rápido possível. Isso o ajuda a criar uma base mais confiável para a disponibilidade e o desempenho de todos os seus serviços nas camadas.
Sem o PRTG, se o seu banco de dados for executado em um ritmo de caracol, retornar erros para determinadas consultas ou não estiver disponível, o desempenho e a qualidade de todos os aplicativos e a funcionalidade de armazenamento dependentes desse banco de dados também serão prejudicados.

Todo mundo conhece aquele aplicativo da web que não carrega os conjuntos de dados armazenados ou que fica travando o tempo todo. O PRTG permite que você mantenha um olho constante na disponibilidade do seu banco de dados MySQL.
Reduza o tempo de inatividade do banco de dados e reaja imediatamente a interrupções - para maior satisfação do cliente e produtividade aprimorada dos funcionários.
Nosso software de monitoramento do MySQL também fica de olho em outros dados de desempenho do MySQL. O TI consulta automaticamente os bancos de dados e mede o tempo necessário para estabelecer uma conexão, executar uma consulta SQL, lidar com uma transação e desconectar.
Dessa forma, você pode garantir que o seu site ou loja on-line, por exemplo, seja executado sem problemas e sem soluços.
Defina limites de desempenho personalizados e o PRTG o alertará prontamente por SMS, e-mail, mensagem do Slack e outros métodos se o seu banco de dados estiver indisponível ou se determinadas consultas não retornarem os valores desejados (ou retornarem valores incorretos).
Reaja aos problemas antes que eles aumentem e mostre aos seus colegas que você está sempre um passo à frente dos problemas de rede.
Com o PRTG, você pode criar relatórios de banco de dados personalizados e distribuí-los automaticamente para sua equipe. Configure o conteúdo de seus relatórios com os dados que você deseja e gere-os "on the fly" ou crie-os automaticamente.
Por exemplo, você pode encaminhar as estatísticas mais importantes do site para a equipe de Marketing ou ter o número de tíquetes abertos enviados automaticamente para a equipe de Suporte.
Diagnostique problemas de rede rastreando continuamente a disponibilidade e a saúde de seus servidores MySQL, incluindo o desempenho da consulta. Mostre o tempo de execução da consulta, as operações de E/S do disco, o tempo de atividade, a latência, o tempo de resposta, a taxa de transferência e outras métricas importantes de desempenho em tempo real. Visualize os dados de monitoramento em gráficos e painéis claros para identificar problemas com mais facilidade. Obtenha a Visão Geral necessária para solucionar problemas de consultas lentas, gargalos no banco de dados e outros problemas de desempenho.

Gráfico de dados de tráfego ao vivo no PRTG

Visualização em árvore de dispositivos da configuração completa de monitoramento

Painel PRTG personalizado para manter um olho em toda a infraestrutura de TI
Gráfico de dados de tráfego ao vivo no PRTG
Visualização em árvore de dispositivos da configuração completa de monitoramento
“Ganha tudo monitor
de rede”
“A verdadeira beleza do PRTG são as infinitas possibilidades que oferece”
“O PRTG Network Monitor é muito difícil de ser superado”
Use consultas SQL autodefinidas para monitorar uma variedade de KPIs, como:
As possibilidades são praticamente infinitas. O único requisito: Você deve definir uma instrução SQL apropriada.
Salve toda a sua instrução SQL em um arquivo de consulta separado em seu disco rígido na pasta do programa PRTG. Certifique-se de usar a extensão de arquivo .sql para o arquivo e selecione o seguinte caminho:
C:\Arquivos de Programas (x86)\PRTG Network Monitor\Custom Sensors\sql\mysql
Adicione um dispositivo à árvore de dispositivos do PRTG que representa sua instância do MySQL e, em seguida, adicione um sensor MySQL v2 sensor.
Configure o sensor escolhendo o arquivo SQL que contém sua instrução SQL e decida, por exemplo, se você simplesmente deseja monitorar o tempo de execução da consulta MySQL ou se você também gostaria de analisar e processar os valores da tabela de dados.
O PRTG vem com mais de 250 tipos de sensores nativos para monitorar todo o seu ambiente local, na nuvem e na nuvem híbrida. Confira alguns exemplos abaixo!
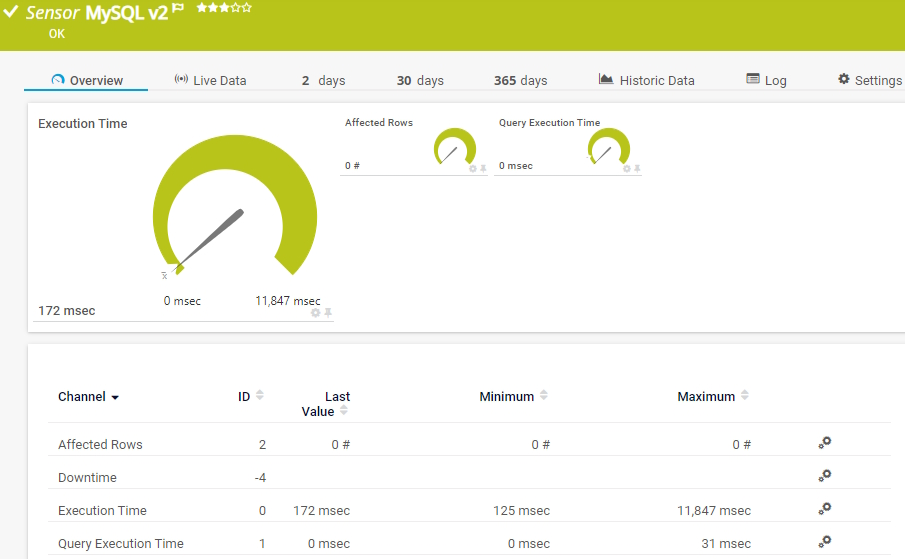
O sensor MySQL v2 monitora um banco de dados em um servidor MySQL e executa uma consulta. Ele pode mostrar o seguinte:
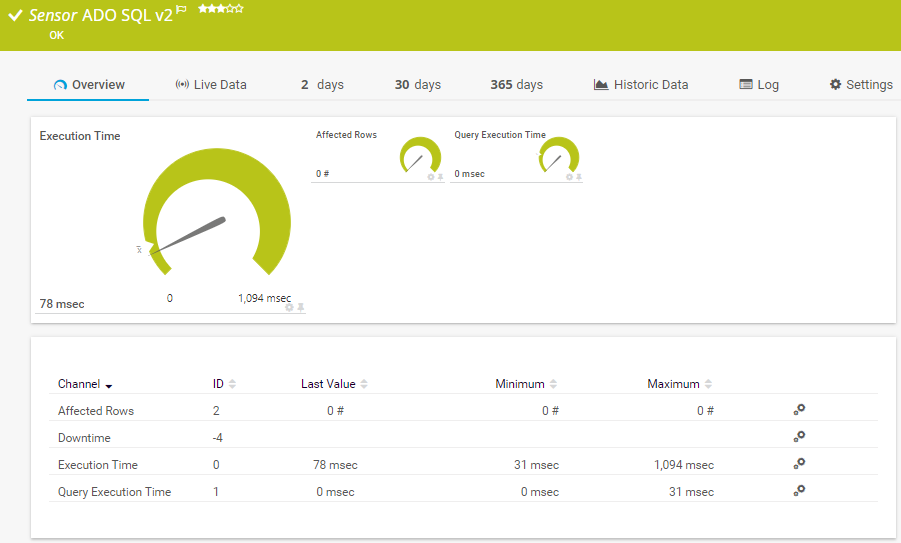
O sensor ADO SQL v2 monitora um banco de dados por meio de uma conexão ActiveX Data Objects (ADO) e executa uma consulta SQL. Ele pode mostrar o seguinte: - Número de linhas que foram abordadas pela consulta
O sensor Microsoft SQL v2 monitora um banco de dados em um servidor Microsoft SQL e executa uma consulta. Ele pode mostrar o seguinte:
O sensor PostgreSQL monitora um banco de dados em um servidor PostgreSQL e executa uma consulta. Ele pode mostrar o seguinte:
Consulte o Manual do PRTG para obter uma lista de todos os tipos de sensores disponíveis.

Alertas personalizados e visualização de dados permitem que você identifique e evite rapidamente tempos de execução lentos, servidores de banco de dados que não respondem e outros problemas com seu ambiente de banco de dados.
O PRTG é configurado em questão de minutos e pode ser usado em uma ampla variedade de dispositivos móveis.

Em parceria com fornecedores de TI inovadores, a Paessler libera sinergias para criar benefícios novos e adicionais para os clientes associados.

A combinação do amplo conjunto de recursos de monitoramento do PRTG com a garantia de rede automatizada do IP Fabric cria um novo nível de visibilidade e confiabilidade da rede.

A Siemon e a Paessler reúnem tecnologia de construção inteligente e monitoramento avançado e tornam realidade sua visão de edifícios e data centers inteligentes.

O UVexplorer integra-se perfeitamente ao PRTG para proporcionar descoberta de rede rápida e precisa, inventário detalhado de dispositivos e mapeamento automático de rede para a plataforma PRTG.
As notificações em tempo real significam uma solução de problemas mais rápida para que você possa agir antes que ocorram problemas mais sérios.
Software de monitoramento de rede – Versão 24.4.102.1351 (November 12th, 2024)
Download para Windows e versão baseada em nuvem do PRTG Hosted Monitor disponível
Inglês, alemão, espanhol, francês, português, holandês, russo, japonês e chinês simplificado
Dispositivos de rede, largura de banda, servidores, aplicativos, ambientes virtuais, sistemas remotos, IoT e muito mais
Escolha a assinatura do PRTG Network Monitor que é melhor para você


O MySQL é um sistema de gerenciamento de banco de dados de código aberto baseado na linguagem de consulta estruturada (SQL). Além de estar disponível gratuitamente, o MySQL tem a vantagem de ser executado em quase todas as plataformas. O MySQL é um dos sistemas de bancos de dados relacionais mais usados no mundo, e muitos sites dinâmicos são construídos com base nele. Junto com a variedade de código aberto, há também uma edição comercial do MySQL Enterprise. O MySQL tem uma arquitetura de mecanismo de armazenamento conectável que permite aos usuários selecionar um mecanismo de armazenamento individual, como o InnoDB ou o MyISAM.
O monitoramento do MySQL envolve o processo de rastreamento e análise do desempenho, da integridade e do uso dos bancos de dados MySQL para garantir que eles estejam funcionando de forma ideal. TI ajuda os administradores e desenvolvedores de bancos de dados a identificar possíveis problemas, otimizar o desempenho e manter a confiabilidade e a disponibilidade do sistema de banco de dados. Os principais aspectos do monitoramento do MySQL incluem:
Monitorar os bancos de dados MySQL é importante por vários motivos, por exemplo:
Sem dúvida. O PRTG vem com sensores pré-configurados para MS SQL, Oracle SQL, PostgreSQL e ADO SQL. Para monitorar bancos de dados como IBM DB2, SAP HANA ou SAP MaxDB, você precisará da extensão de produto PRTG Database Observer.
No PRTG, “sensores” são os elementos básicos de monitoramento. Um sensor geralmente monitora um valor medido na sua rede, por exemplo, o tráfego em uma porta de switch, a carga de CPU de um servidor ou o espaço livre em uma unidade de disco. Em média, você precisa de 5-10 sensores por dispositivo ou um sensor por porta de switch.
A Paessler realizou testes em mais de 600 departamentos de TI em todo o mundo para sintonizar seu software de monitoramento de rede mais próximo às necessidades dos administradores. O resultado da pesquisa: mais de 95% dos participantes recomendaria PRTG – ou já o fizeram.

Paessler PRTG é usado por empresas de todos os tamanhos. Os administradores adoram PRTG porque ele facilita muito o trabalho.
Largura de banda, servidores, ambientes virtuais, websites, serviços VoIP – PRTG monitora toda a sua rede.
As necessidades de monitoramento variam. Por isso deixamos você experimentar PRTG gratuitamente. Comece agora mesmo o seu período de testes.