Custom alerts and data visualizations let you quickly identify and prevent corrupted data and associated network performance issues.
Ensuring your network performs optimally without accessing the Management Information Bases of the devices you want to monitor is like trying to find your way around a city you've never been to before. Blindfolded.
But, the larger and more complex your network is, the harder it is to read and analyze your MIB files – or even integrate them into your monitoring setup.
Our free SNMP MIB browser for Paessler PRTG makes reading, analyzing, and changing MIB files quick and effortless. Import the MIB tree, convert MIB data to the OID format, and set up PRTG sensors in a few clicks. We'll even throw in 100 free sensors so you can keep an eye on your network devices’ health and performance via SNMP.

Download the free Paessler MIB Importer and open your chosen MIB files. That's it. You can convert all your MIB files (or just a selection) into OIDs and use them to configure SNMP sensors in minutes. PRTG even automatically detects your devices such as servers, routers, switches, or firewalls.
With 250+ sensors to choose from, the possibilities are endless. We've designed PRTG so you can tailor it to your network's requirements and monitor every aspect of its health and performance with one tool: not just MIB files, but all your hardware, software, network connections, switch ports, or bandwidth.
No, really. The first 100 sensors are free, forever. But if you do buy a license, our flexible, easily scalable licensing and pricing will adapt to your needs. And if you don't believe us, well… 500,000 happy users can't be wrong. Right?
Diagnose network issues by continuously tracking your Windows- or Linux-based servers and other hardware using MIB files. Show OID values, MIB variables, SNMP custom table entries and other device health and performance metrics in real time. Visualize monitoring data in clear graphs and dashboards to identify problems more easily. Gain the overview you need to troubleshoot issues and enjoy a faster, more stable, more reliable network.

Live traffic data graph in PRTG

Device tree view of the complete monitoring setup

Custom PRTG dashboard for keeping an eye on the entire IT infrastructure
Live traffic data graph in PRTG
Device tree view of the complete monitoring setup
“All-around winning
network monitor”
“The real beauty of PRTG is the endless possibilities it offers”
“PRTG Network Monitor
is very hard to beat”
Once you've downloaded the relevant MIB file from the manufacturer's website, and downloaded and installed Paessler MIB Importer, setting up a PRTG sensor is pretty easy:
You can create up to 100 sensors for free, including:
PRTG comes with more than 250 native sensor types for monitoring your entire on-premises, cloud, and hybrid cloud environment out of the box. Check out some examples below!
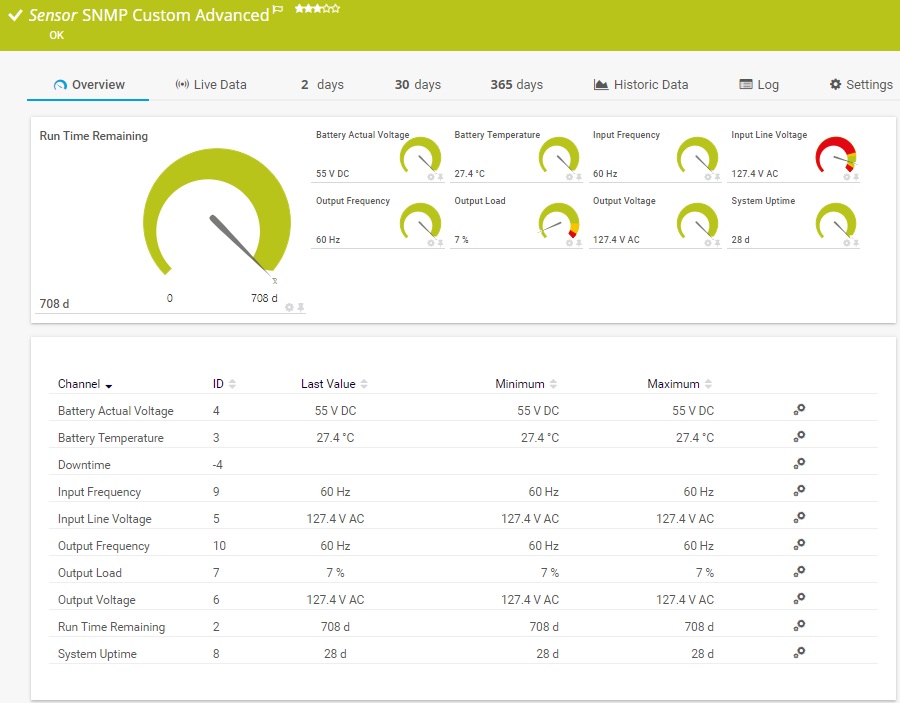
The SNMP Custom Advanced sensor monitors numeric values returned for object identifiers (OID). It can show the following:
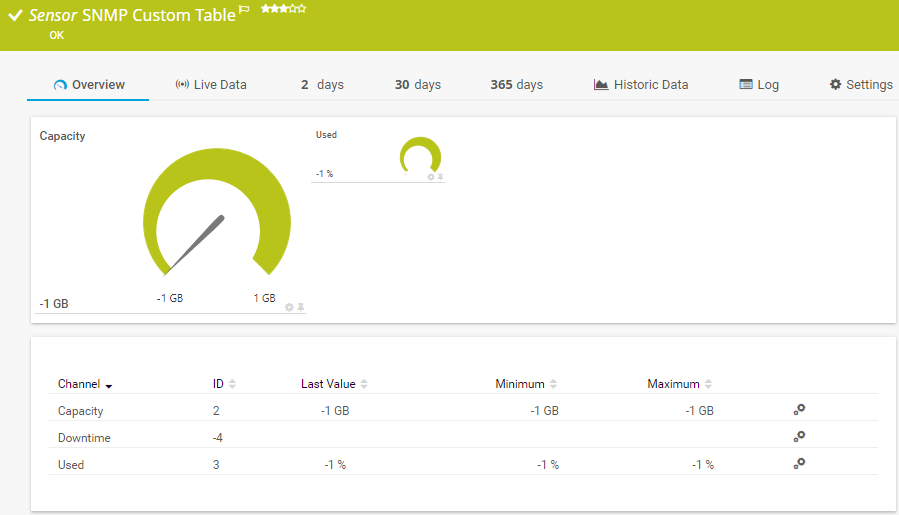
The SNMP Custom Table sensor monitors entries from a table. You can create one new sensor per table row. It can show the following:
See the PRTG Manual for a list of all available sensor types.

Custom alerts and data visualizations let you quickly identify and prevent corrupted data and associated network performance issues.
PRTG is set up in a matter of minutes and can be used on a wide variety of mobile devices.

Partnering with innovative IT vendors, Paessler unleashes synergies to create
new and additional benefits for joined customers.

Combining PRTG’s broad monitoring feature set with IP Fabric’s automated network assurance creates a new level of network visibility and reliability.

Paessler and Plixer provide a complete solution adding flow and metadata analysis to a powerful network monitoring tool.

With ScriptRunner Paessler integrates a powerful event automation platform into PRTG Network Monitor.
Real-time notifications mean faster troubleshooting so that you can act before more serious issues occur.
Network Monitoring Software – Version 24.4.102.1351 (November 12th, 2024)
Download for Windows and cloud-based version PRTG Hosted Monitor available
English, German, Spanish, French, Portuguese, Dutch, Russian, Japanese, and Simplified Chinese
Network devices, bandwidth, servers, applications, virtual environments, remote systems, IoT, and more
Choose the PRTG Network Monitor subscription that's best for you


MIB stands for “Management Information Base”. MIB files contain information you need to monitor and control a router, switch, or other specific network device. An OID or “object identifier”, on the other hand, is a series of numbers that identifies an object in the MIB hierarchy and that can be read via SNMP. Think of it this way: a MIB is like a house you want to get to, and an OIB is the set of coordinates you pop into your GPS so you can reach it without getting lost.
A Management Information Base (MIB) is a virtual database used for managing the entities in a computer network. It is an essential component of network management protocols like SNMP (Simple Network Management Protocol).
Structure:
Object Identifiers (OIDs):
Managed objects:
Usage:
MIB files:
Because devices from different manufacturers all work differently, it's impossible for monitoring software to cover every possible scenario. MIB files enable you to tailor monitoring sensors to your specific device and situation.
A MIB converter typically refers to a tool or software that translates Management Information Base files from one format to another. These converters facilitate compatibility between different network management systems or devices that might use different MIB file formats.
Cisco, Juniper, Dell, and other reputable device manufacturers usually make MIB files available in the downloads section of their websites. The Internet Engineering Task Force, or IETF for short, has published a global MIB standard, and included MIBs in more than 300 of its first 5,000 RFCs.
SNMP (Simple Network Management Protocol) is a widely used protocol for managing and monitoring devices on a network. It provides a standardized way for network administrators to collect and organize information about SNMP-enabled devices on their network, such as routers, switches, servers, printers, and more, as well as to configure these devices remotely.
There are three versions of SNMP:
SNMPv1: The original version, offering basic features and limited security (plaintext community strings).
SNMPv2c: An improved version with better performance, additional protocol operations, and more data types, but still relying on simple community strings for security.
SNMPv3: The latest version, providing enhanced security features, including message integrity, authentication, and encryption.
Key components of SNMP include:
Managed devices:
SNMP agents:
Network Management System (NMS):
Management Information Base (MIB):
In PRTG, “sensors” are the basic monitoring elements. One sensor usually monitors one measured value in your network, for example the traffic of a switch port, the CPU load of a server, or the free space on a disk drive. On average, you need about 5-10 sensors per device or one sensor per switch port.
Paessler conducted trials in over 600 IT departments worldwide to tune its network monitoring software closer to the needs of sysadmins. The result of the survey: over 95% of the participants would recommend PRTG – or already have.

Paessler PRTG is used by companies of all sizes. Sysadmins love PRTG because it makes their job a whole lot easier.
Bandwidth, servers, virtual environments, websites, VoIP services – PRTG keeps an eye on your entire network.
Everyone has different monitoring needs. That’s why we let you try PRTG for free.