Videos
The Paessler support team has recorded some videos to help you start monitoring your network with PRTG.
The topics cover installation and auto-discovery, setting up notifications, and background
information on using remote probes in distributed networks.
![]() 18:40
18:40
Smart setup
This video shows how to install PRTG Network Monitor and how to configure the software to track bandwidth, network traffic, and to monitor network devices.
![]() 03:09
03:09
Distributed monitoring with PRTG
This animation video describes how PRTG Network Monitor monitors your local network as well as remote networks using different types of probes.
![]() 03:10
03:10
Quick overview of PRTG
Get a first impression of PRTG Network Monitor and see how easy it is to monitor your entire network. These are also helpful for a quick start if you are a new user.
![]() 05:17
05:17
Auto-update
Auto-Update for PRTG Network Monitor: As soon as a new version of PRTG is available, you get an email and can update your version.
![]() 07:20
07:20
Bandwidth monitoring with SNMP and WMI
This video gives you a great overview on bandwidth monitoring with SNMP and WMI with Paessler's network monitoring solution PRTG Network Monitor.
![]() 05:19
05:19
PRTG Administration Tool
This video explains the PRTG Administration Tool and its configuration possibilities during the installation of web servers, clusters etc.
![]() 18:01
18:01
SNMP debugging
You want to learn what to do when you have problems with SNMP sensors? See what settings to consider and how to use the SNMP Tester for debugging.
![]() 16:10
16:10
SNMP basics
Watch our tutorial and you will get a short introduction to SNMP and all SNMP-based sensors in PRTG. At the end you will be able to set up a SNMP sensor.
![]() 07:03
07:03
Libraries in PRTG
Learn how to set up your own libraries within the network monitoring solution PRTG Network Monitor to get additional customized views of your device tree.
![]() 01:49
01:49
Sensor count
Watch our video and learn more about your sensors, how many you have configured in your PRTG, and how easy it is to upgrade your license.
![]() 04:59
04:59
Use cases for notifications
This video shows you some practical examples of how to use notifications in PRTG Network Monitor. We prepared a few use cases for you so you can see them in use.
![]() 14.52
14.52
Notifications
This video answers your questions about notifications in PRTG Network Monitor: why you need them, what types exist, to whom you can send them, and much more.
![]() 03:27
03:27
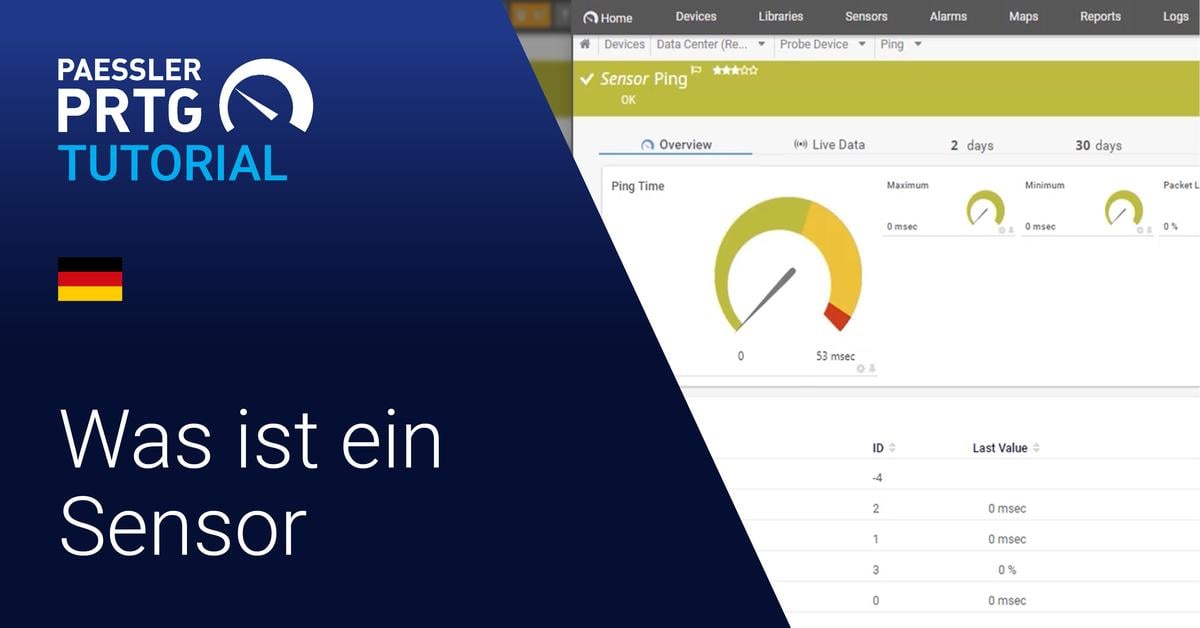
What is a sensor?
What, exactly, is a "sensor" within PRTG? What is a "channel"? This video discusses PRTG sensors and channels including a few concrete examples of both to illustrate this fundamental PRTG concept.
![]() 07:23
07:23
Sensor states
PRTG sensors can have multiple states, including up, down, warning, and several others. In this video, we explain the different states that are possible, what situations lead to those states, and how to view a list of sensors in each status.
![]() 04:51
04:51
Bandwidth monitoring methods
Here´s a very brief overview of the methods PRTG offers for monitoring bandwidth to help you decide which methods you´d like to consider in more detail.

![]() 05:35
05:35
Support ticket
Do you have a question about PRTG or need help with an issue? This video shows the different ways you can contact our support team to get the answers that you are looking for.
![]() 02.35
02.35
PRTG version numbers and release channels
What do the parts of a PRTG version number mean? And what’s a canary release? This video explains how PRTG version numbers work, and describes the three software release channels Paessler offers.
![]() 07:37
07:37
How to edit the device tree
PRTG Network Monitor has a hierarchical structure of probes, groups, devices, and sensors, called the device tree. The PRTG auto-discovery process will create a tree and group devices according to device type, such as network devices, servers, storage, etc.
![]() 04:53
04:53
How to set channel limits
In this video, you’re going to learn how to configure channel limits in PRTG. The channel limits are the upper and lower threshold limits where you would like your sensors to go into Warning or Down status, so you can get a notification when something goes wrong.
![]() 01:41
01:41
When does a sensor change its status in PRTG?
PRTG sensors can have multiple states, including up, down, warning, and several others. In this video, we explain the different states that are possible, what situations lead to those states, and how to view a list of sensors in each status.
![]() 02:50
02:50
How to add a sensor manually in PRTG
Wondering how you can add a sensor in your PRTG installation? Learn all about the three methods in this video.

![]() 08:48
08:48
PRTG installation for GUDE Appliances
In this video, we show you how to set up monitoring of temperatures and PDUs with GUDE appliances and PRTG. PDUs enable you to ensure the distribution of electric power to your data center. GUDE offers appliances to measure environmental values like the temperature of your server room.

![]() 02:06
02:06
Making the lives of sysadmins easier
Monitor your network, systems, applications, and more with PRTG Network Monitor. Get alerts and notifications when there are issues, and know the health of your network. Find out how our passion for monitoring can make your life as a sysadmin easier!
![]() 03:33
03:33
Overview of the PRTG web interface
Use the PRTG web interface as default interface to set up your monitoring and bring it to perfection.
![]() 13:25
13:25
SNMP Trap receiver and syslog receiver
Learn how to create and configure a Syslog Receiver and a Trap Receiver sensor in PRTG Network Monitor. See how easily you can manage and filter these messages and learn how easy it is to keep an eye on your network via SNMP.
![]() 10:43
10:43
Ticketing system
Have a look at our ticketing system inside PRTG Network Monitor and learn how to manage information about issues and tasks while monitoring your network.
![]() 08:30
08:30
Creating maps in PRTG
In our new video we demonstrate how to set up a map within PRTG by using icons that represent the different devices, groups, and sensors in your network, and its connections. In the end, you'll have a great overview on the components' status in your network on one page!
![]() 20:03
20:03
Bandwidth monitoring with flows and packet sniffing
In this tutorial, you will learn everything about bandwidth monitoring with flows and paket sniffing with PRTG Network Monitor.
![]() 11:26
11:26
SNMP custom sensor and custom Library sensor
Here you will learn how to import MIB files into PRTG and how to use the OIDs in the MIB files to create SNMP Custom sensors and SNMP Custom Library sensors.
![]() 08:35
08:35
How to set up a PRTG cluster
We will explain in this video what you need to consider up front and how to set up a PRTG cluster with two servers: one master server and one failover server.
![]() 07:34
07:34
Sensor Factory sensor
In this video, you'll learn about situations where a Sensor Factory sensor is useful, and how to create one step-by-step. This sensor can help you monitor complex processes by combining the results from several sensors into a single, composite sensor.
![]() 11:45
11:45
Extending maps
We expand our map from the "Create Maps" video. You'll learn how to visualize firewall traffic, expand the map, add weather data from an external source, and how to divide the map visually into different areas. Learn all there is to know about maps and create a dynamic overview of your IT infrastructure.
![]() 03:30
03:30
PRTG for iOS - Tutorial
In this short tutorial, we show you how easy it is to control your PRTG installation with our "PRTG for iOS" App. So you always have your network in view, even when on the go with your smartphone or smartwatch!
![]() 07:02
07:02
PRTG for Android - Tutorial
This tutorial shows you how easily you can manage your PRTG installation with the PRTG for Android app. You can even monitor your network when you are on the go!
![]() 00:38
00:38
PRTG for Android – Watch app
This video shows you a new feature for the Android app: PRTG for Android Wear allows you to respond to sensors in a Down status directly from your smartwatch.
![]() 08:45
08:45
Windows sensors
Heather shows you how to use SNMP and WMI sensors to monitor Windows with PRTG.
![]() 06:35
06:35
VMware sensors
Heather takes you through the PRTG VMware sensors, and shows you how to monitor the ESXi host, the virtual guests, and the ESX datastores.
![]() 07:10
07:10
Auto-discovery groups
Watch this tutorial to learn how to use auto-discovery groups and device templates.
![]() 08:09
08:09
DICOM Sensor
Shaun explains how you can use the DICOM sensor in PRTG to monitor healthcare IT environments.
![]() 02:44
02:44
HL7 Sensor
In healthcare IT, a lot of information is communicated using HL7. In this video, Shaun shows you how the HL7 sensor in PRTG.
![]() 04:50
04:50
Business Process Sensor
You can monitor not only uptime, but also entire workflows in your healthcare IT infrastructure using PRTG. Shaun shows you how PRTG uses Business Process sensors to monitor all the aspects of a radiology workflow.
![]() 05:29
05:29
PRTG Desktop app
PRTG Desktop is an alternative interface that you can use to connect to the PRTG core server to configure your setup, view monitoring results, and keep an eye on your network.
![]() 05:20
05:20
Sunburst view of PRTG
Use the sunburst option to get a different view of your devices. Watch the video to learn more.
![]() 27:42
27:42
Monitoring a Sigfox device
Sigfox technology enables objects and devices to connect to a global IoT network. If you have Sigfox devices sending data to the Sigfox Cloud, you can monitor the devices using PRTG. We explain how in this video.
![]() 05:03
05:03
Overview of the DNS v2 sensor
The DNS v2 sensor monitors a Domain Name System (DNS) server, resolves domain name records, and compares them to a filter.
![]() 03:14
03:14
MQTT Round Trip sensor
The MQTT Round Trip sensor monitors the availability of a Message Queue Telemetry Transport (MQTT) broker (server), connects to the broker as a publishing and subscribing client, and sends the data packets using a predefined topic.
![]() 03:50
03:50
MQTT Subscribe Custom Sensor
The MQTT Subscribe Custom sensor subscribes to a Message Queue Telemetry Transport (MQTT) topic and monitors up to five numerical values from the received JSON data.I
![]() 02:46
02:46
MQTT Statistics Sensor
The MQTT Statistics Sensor helps you to monitor your IoT devices, to check if they send messages to the broker and the number of sent messages.
![]() 04:09
04:09
WMI Disk Health & WMI Storage Pool sensor
The WMI Storage Pool sensor monitors a storage pool and the WMI Disk Health sensor monitors the health of a physical disk on a Windows system via Windows Management Instrumentation (WMI).
![]() 04:30
04:30
Two Nutanix sensors: SNMP Nutanix Hypervisor and SNMP Nutanix Cluster Health
For users of Nutanix’ hyperconverged infrastructure (HCI) technology, PRTG provides two SNMP Nutanix sensors.
![]() 05:04
05:04
Modbus TCP sensor
In this video we explain how the Modbus TCP Sensor works. This sensor monitors values that your Modbus TCP server returns. With this new sensor type, you can keep an eye on your peripheral equipment.
![]() 02:41
02:41
MQTT notifications
In this video we explain how to set up and configure MQTT notifications in PRTG to forward alerts, warnings or other information to a system of interest.
![]() 04:53
04:53
Device templates
In this video we explain how to only ad the sensors of interest in PRTG by customizing the PRTG auto-discovery with filter criteria.
![]() 07:45
07:45
Microsoft Azure Virtual Machine Sensor
The Microsoft Azure Virtual Machine sensor monitors the status of a virtual machine in a Microsoft Azure subscription.
![]() 10:24
10:24
Single sing-on (SSO) login via Azure AD (now Entra ID)
In this video our product owner Souzana explains the configuration process in both Azure portal and PRTG in order to enable SSO login.
![]() 08:19
08:19
Microsoft Azure SQL Database sensor
The Microsoft Azure SQL Database sensor monitors the metrics of an Azure SQL Database (single database or elastic pool) in a Microsoft Azure subscription.
![]() 09:35
09:35
Microsoft Azure Subscription Cost Sensor
In this video you will see how the Microsoft Azure Subscription Cost sensor monitors the cost in a Microsoft Azure subscription.
![]() 07:51
07:51
Microsoft Azure Storage Account Sensor
In this tutorial video you will see how the Microsoft Azure Storage Account sensor monitors the storage account in a Microsoft Azure subscription.
![]() 07:09
07:09
REST Custom v2 sensor
In this video our product owner Souzana explains, how the REST Custom v2 sensor works. Using Gitlab API as an example, she shows the configuration process of the sensor.
![]() 04:50
04:50
Experimental features in PRTG
What are experimental sensors in PRTG and where can you can find them? You will also learn how easy it is to provide your feedback and how that shapes the future of PRTG.

![]() 10:40
10:40
Paessler PRTG Enterprise Monitor: A technical introduction
For monitoring large IT infrastructures Paessler PRTG Enterprise Monitor is the right choice for you. In this video you get a first technical introduction.

![]() 07:10
07:10
New API (alpha version) for PRTG
In this video, Nina explains, how to activate the alpha version of the new API in PRTG, and gives you a first preview on what the first steps with the new API looks like.
![]() 06:18
06:18
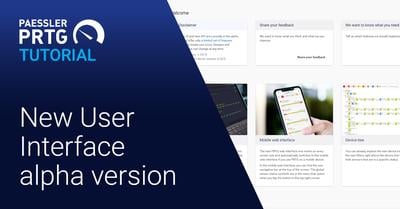
New UI (alpha version) for PRTG
In this video, Nina explains, how to activate the alpha version of the new User Interface in PRTG, and gives you a first preview on what the first steps with the new interface looks like.

![]() 04:27
04:27
Redfish System Health Sensor
The video explains how the Redfish System Health sensor monitors the system health of a Redfish Scalable Platforms Management API (Redfish)-capable server.
![]() 04:48
04:48
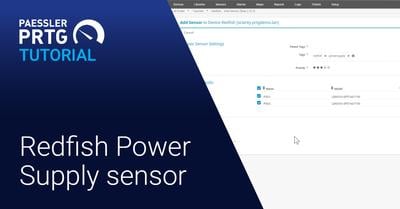
Redfish Power Supply Sensor
This video explains how the Redfish Power Supply Sensor monitors the performance metrics of your power supplies in your system.
![]() 04:37
04:37
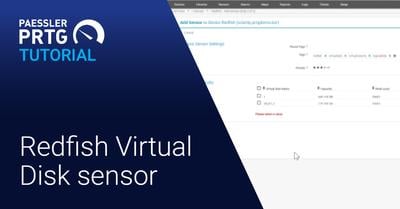
Redfish Virtual Disk Sensor
This video explains how the Redfish Virtual Disk sensor monitors the status of your virtual disk and the status information in general.
![]() 05:52
05:52
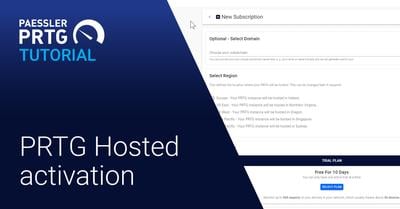
Activation process of PRTG Hosted Monitor
In this video we guide you through the activation process of PRTG Hosted Monitor. Your PRTG instance will be ready within minutes.
![]() 03:14
03:14
Cisco Meraki License Sensor
The Cisco Meraki License sensor (beta) monitors Meraki licenses of an organization via the Cisco Meraki Dashboard API. This video shows how it works.
![]() 03:17
03:17
Cisco Meraki Network Health Sensor
This video explains how the Cisco Meraki Network Health sensor monitors the health of Cisco Meraki network devices via the Cisco Meraki Dashboard API.
![]() 04:17
04:17
Veeam monitoring with PRTG sensors
You don't want to lose your data? Then start with Veeam monitoring. PRTG Network Monitor offers several Veeam sensors. This video shows how they can help you!
![]() 05:22
05:22
Hyper-v monitoring with PRTG sensors
This video shows how you can easily set up your Hyper-v monitoring with our PRTG sensors. Try it yourself!
![]() 03:59
03:59
Dell PowerEdge Sensors
This video is about monitoring Dell PowerEdge servers using PRTG. We at Paessler offer native sensors to get insights into the health state of different hardware components in your Dell PowerEdge.
![]() 05:05
05:05
Paessler PRTG Hosted Monitor – installing remote probes
In today's video, Mike will show you how to install remote probes with PRTG Hosted Monitor. Watch the tutorial now!
![]() 07:41
07:41
HPE ProLiant monitoring
In today’s video, Jasmin will talk about HPE ProLiant servers and how to setup PRTG sensors to monitor your HPE hardware with PRTG.
![]() 07:47
07:47
Paessler PRTG Hosted Monitor – device templates and MIB data
In this video tutorial, Mike explains the usage of device templates and MIB Data in PRTG Hosted Monitor.
![]() 06:20
06:20
PRTG OPC UA Server – server configuration
Our software developer Michael gives you an introduction on the server configuration of the PRTG OPC UA Server.
![]() 12:20
12:20
Multi-platform probe: configuration
In this video we guide you through the installation and configuration of a multi-platform probe which can run on Ubuntu Linux, Debian Linux, RHEL/CentOS, or Rasperry PI OS. ➤ Start watching the video!
![]() 06:29
06:29
Multi-platform probe – introduction
In this tutorial video you learn about the benefits of the multi-platform probe and how to get started. ➤ Start watching the video!
![]() 10:11
10:11
Lookups in PRTG
Mike shows you how to use lookups in PRTG and where to find them. Good to know: Standard lookups, basically the ones that are not in the lookups\custom directory will be overwritten on update install.
![]() 11:58
11:58
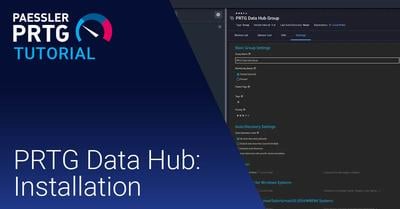
PRTG Data Hub – installation
Michael shows how to install the Paessler PRTG Data Hub. What is the data hub? The data hub is the network message relay where you can filter and split the network messages coming in and going out.
![]() 25:54
25:54
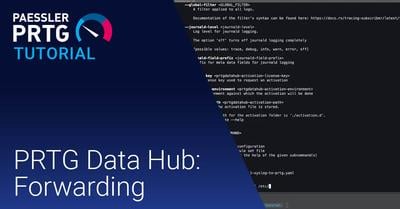
PRTG Data Hub – forwarding
Michael has a look at the forwarding use case of the Paessler PRTG Data Hub which is a network message relay application where you can also filter on different network protocols.
![]() 15:42
15:42
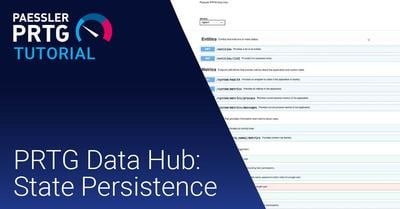
PRTG Data Hub – state persistence
Michael is going to talk about the Paessler PRTG Data Hub, especially the state persistence feature which keeps the state of sending devices. You can assign properties depending on the messages.
![]() 11:00
11:00
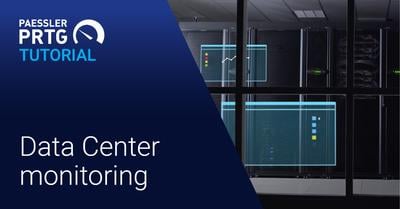
Data center monitoring
In this video, we show how to monitor your physical datacenter infrastructure with PRTG Network Monitor.
![]() 07:38
07:38
Reporting basics
PRTG includes a reporting engine for ad-hoc as well as scheduled report generation in HTML, PDF, CSV, and XML format. In this video, we show you how to use the out-of-the-box reports provided by PRTG, and how to set up your own custom reports.
![]() 12:10
12:10
ITOps Board – installation tutorial
ITOps Board is part of Paessler PRTG Enterprise Monitor. This tutorial shows the installation process of ITOps Board step by step.
![]() 12:23
12:23
ITOps Board: Boards explained
Different stakeholders within an organization require access to information of interest. This is possible and easy in ITOps Boards by creating real-time dashboards across multi-PRTG Core Servers for quick drill-down and analysis.
![]() 13:03
13:03
ITOps Board: Services explained
The uptime of any business service will be impacted by several aspects - from the end user, application, infrastructure or supplier services perspective. ITOps Board gives you an overview of your business services and in addition the Service Level Agreement.
![]() 11:52
11:52
ITOps Board: Settings explained
As an ITOps Board administrator adding PRTG core server integrations, different roles (Active Directory user groups and users) and their respective accessibility to Searches, Boards and Services is easy and simplified. This makes administrative setup of ITOps Board very uncomplicated.
![]() 15:33
15:33
ITOps Board: Searches explained
In ITOps Board, information from several PRTG core servers can be searched in close to real time and summarized categorically. With a saved search, one has an overview of incidents, groups and services, alerts and components.
![]() 04:18
04:18
OPC UA Server Status sensor
In this video we explain how the OPC UA Server Status sensor works. The OPC UA Server Status sensor monitors the status, uptime, and diagnostic information of your OPC UA server.
![]() 02:36
02:36
OPC UA Certificate sensor
In this video we explain how the OPC UA Certificate sensor works. It monitors the certificate of an OPC UA server and helps you to ensure a consistent machine communication in your shop floor.
![]() 06:37
06:37
OPC UA Custom sensor
In this video we explain how the OPC UA Custom sensor works. You can receive information such as the PLC state, when batteries need to be replaced, device failure or system-specific error states.