Custom alerts and data visualizations let you quickly identify and prevent latency, jitter, packet loss, and VoIP call quality and connectivity issues.
Service level agreements are the recipes of enterprise communications.
Just as recipes list the ingredients, proportions, and instructions you have to follow to create a mouth-watering dish, SLAs lay down the benchmarks for your ISP, VoIP vendor, and other communication services providers must meet for their service to be up to an acceptable standard.
Except, if you don't check, you won't know whether your service providers are keeping up their side of the bargain (unless there's a noticeable degradation in service).
Paessler PRTG's preconfigured Cisco IP SLA sensor pulls key data from your Cisco routers in real time, and alerts you if performance goes below preset thresholds. That means smoother, more productive business calls, a more stable connection, and, most importantly, more bang for your buck.

Jitter. Packet loss. Quality of Service. Bandwidth usage. PRTG brings together your most important VoIP and connectivity metrics in one place, so you can make sure everything's working as it should at a glance (and at any point during the day).
Network monitoring on autopilot. Once you've set your preferred warning and error limits, PRTG tracks them 24/7 and alerts you when your devices are at risk of going over or under. Which means you can swoop in and fix issues promptly, or call your ISP or VoIP provider to let them know.
No Cisco IP SLA-enabled network devices? No problem. You can still monitor VoIP, QoS parameters, your internet connection, and more. With more than 250 preconfigured sensor types, there's almost no limit to which hardware devices and network metrics you can track.
With PRTG working tirelessly in the background, you'll have one… well, actually, several less things to worry about, for example troubleshooting in time. Make short work of your to-do list (and leave the office at a reasonable hour), safe in the knowledge everything's being monitored in your absence.
Diagnose network issues by continuously tracking IP SLA operations on your Cisco devices. Show UDP jitter, latency, packet loss, and other key network performance metrics in real time. Visualize monitoring data in clear graphs and dashboards to identify problems more easily. Gain the overview you need to troubleshoot poor VoIP call quality and other connectivity issues.

Live traffic data graph in PRTG

Device tree view of the complete monitoring setup

Custom PRTG dashboard for keeping an eye on the entire IT infrastructure
Live traffic data graph in PRTG
Device tree view of the complete monitoring setup
“All-around winning
network monitor”
“The real beauty of PRTG is the endless possibilities it offers”
“PRTG Network Monitor
is very hard to beat”
PRTG comes with more than 250 native sensor types for monitoring your entire on-premises, cloud, and hybrid cloud environment out of the box. Check out some examples below!
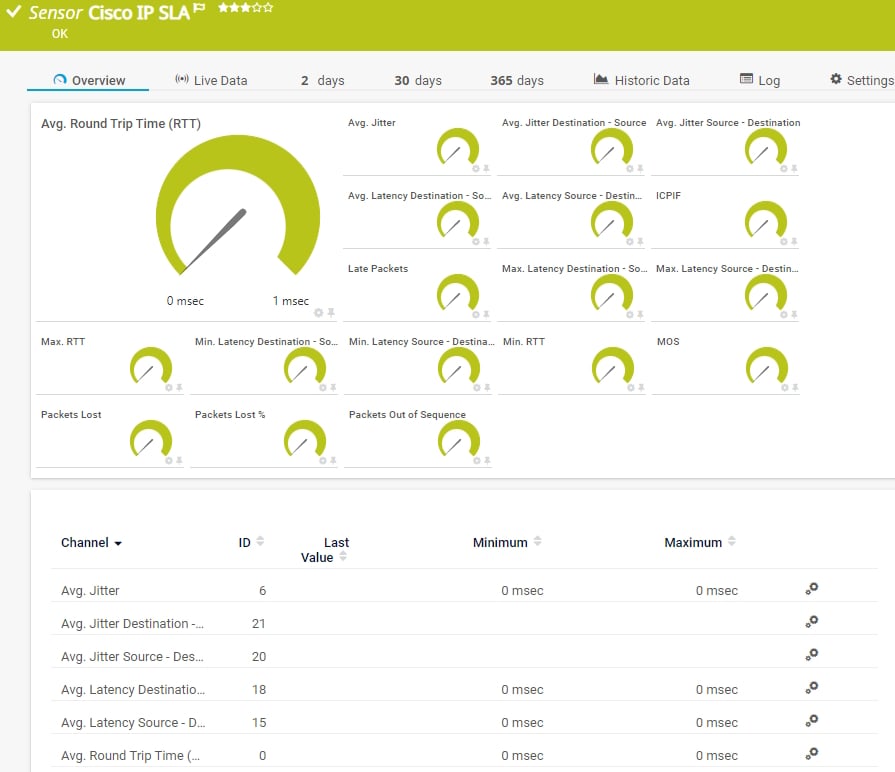
The Cisco IP SLA sensor monitors Voice over IP (VoIP) network parameters using IP service level agreements (SLA) from Cisco. It can show the following:
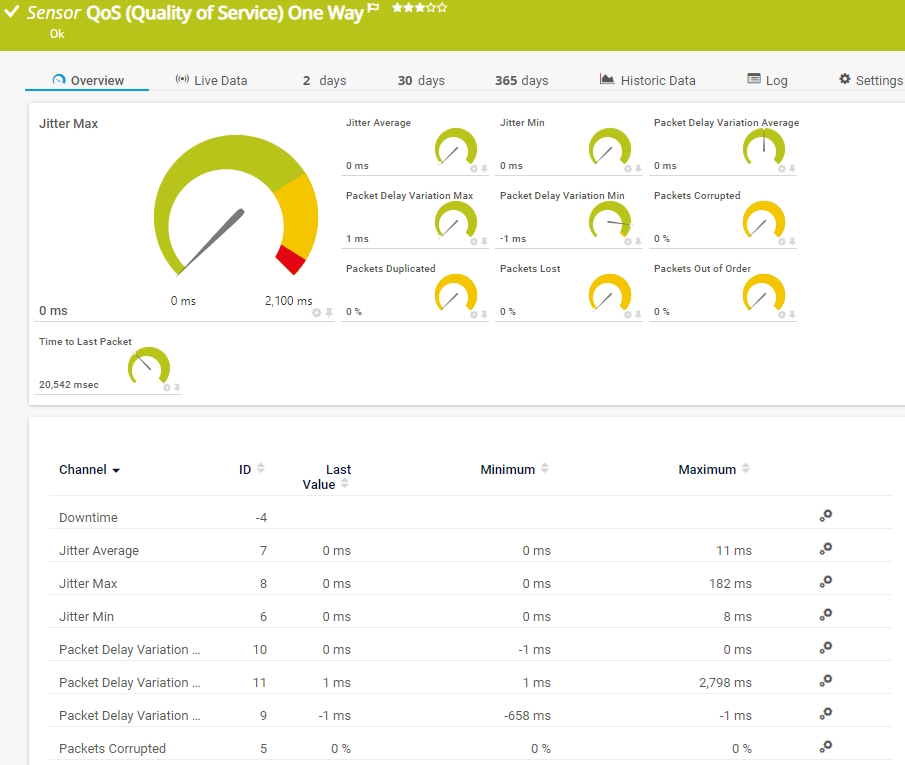
The QoS (Quality of Service) One Way sensor monitors parameters regarding the quality of a network connection between two probes. It can show the following:
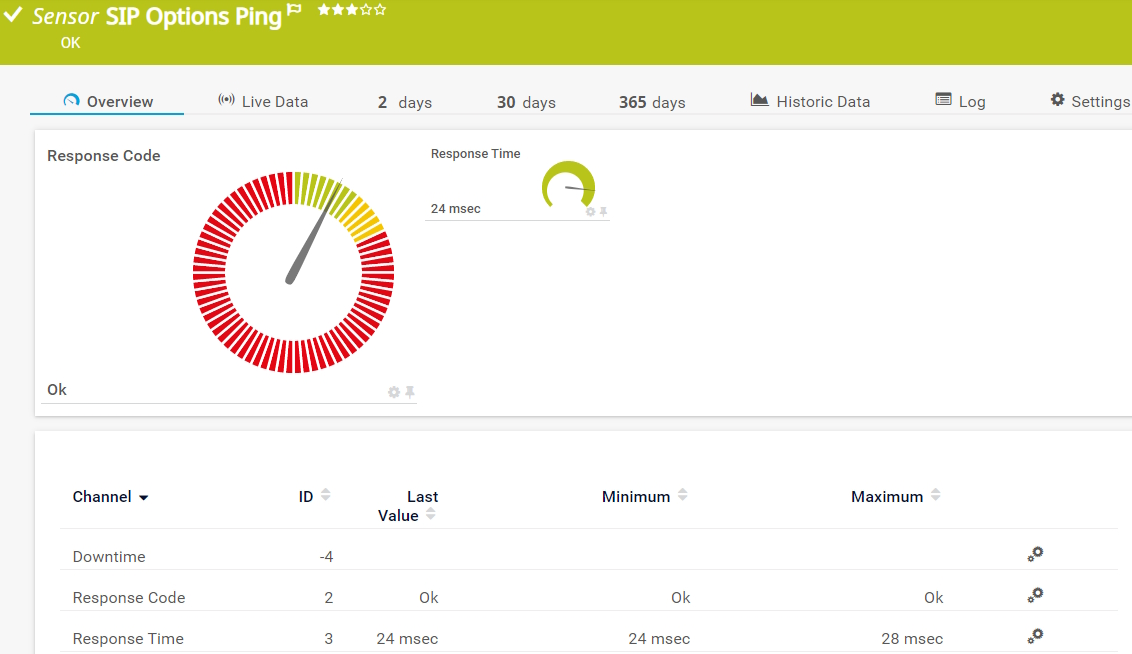
The SIP Options Ping sensor monitors the connectivity to a Session Initiation Protocol (SIP) server using SIP options "ping". The sensor sends auth and options requests to the SIP server. It can show the following:
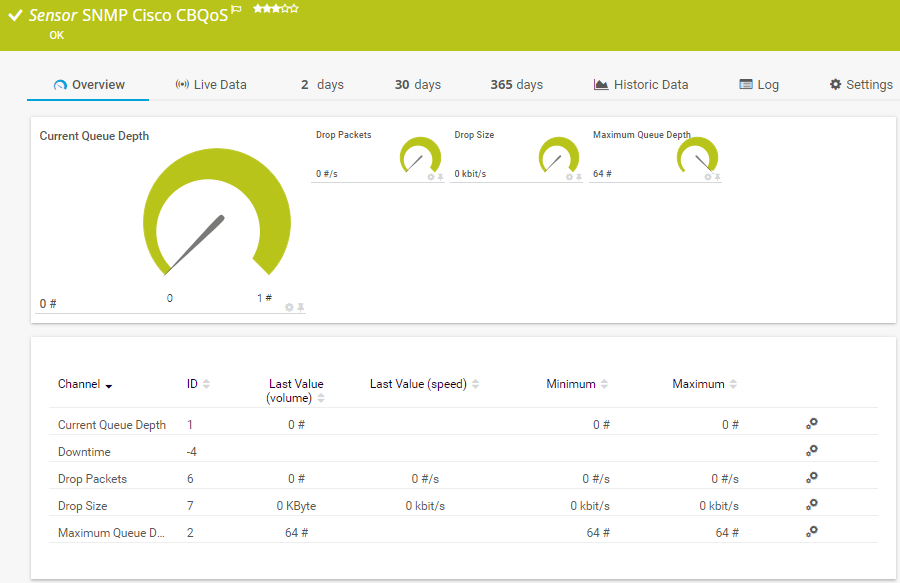
The SNMP Cisco CBQoS sensor monitors network parameters using Cisco's Class Based Quality of Service (CBQoS). It can show the following:
See the PRTG Manual for a list of all available sensor types.

Custom alerts and data visualizations let you quickly identify and prevent latency, jitter, packet loss, and VoIP call quality and connectivity issues.
PRTG is set up in a matter of minutes and can be used on a wide variety of mobile devices.

As a member of the Cisco Partner Program, Paessler is one of the market leaders that enhances the Cisco technology portfolio with products that are proven to easily integrate with Cisco devices.
What does this mean for you?
Partnering with innovative IT vendors, Paessler unleashes synergies to create
new and additional benefits for joined customers.

Combining PRTG’s broad monitoring feature set with IP Fabric’s automated network assurance creates a new level of network visibility and reliability.
Integrating monitoring results from PRTG into NetBrain maps makes the foundation for network automation.

Rhebo and PRTG offer a comprehensive monitoring solution for IT and OT environments: from condition monitoring through to anomaly and threat detection.
Real-time notifications mean faster troubleshooting so that you can act before more serious issues occur.
Network Monitoring Software – Version 24.4.102.1351 (November 12th, 2024)
Download for Windows and cloud-based version PRTG Hosted Monitor available
English, German, Spanish, French, Portuguese, Dutch, Russian, Japanese, and Simplified Chinese
Network devices, bandwidth, servers, applications, virtual environments, remote systems, IoT, and more
Choose the PRTG Network Monitor subscription that's best for you


IP SLA is a feature on Cisco devices such as Cisco IOS that enables you to track latency, jitter, packet loss, VoIP quality and other audio, video, and connectivity performance metrics in real time. Tracking these metrics makes it easier to spot (and fix) issues and optimize your resources. Just as important, it helps you make sure your ISP, VoIP vendor, and other communication services providers are meeting the minimum standards in their service level agreements.
Setting up IP SLA monitoring in PRTG takes only a few minutes. Enter your IP SLA-compatible Cisco device's IP address and SNMP access data in PRTG, then add a Cisco IP SLA sensor and pick the parameters you want to monitor. Your device's current values should appear on your monitoring dashboard as soon as you're up and running.
Yes. PRTG also has several other sensors that can continuously keep an eye on key VoIP metrics like jitter, latency, response time, packet loss, and packet delay. These include Windows-compatible MOS monitoring sensors, and QoS monitoring sensors. You can also monitor quality of service not only via LAN, but also via VPN, Wi-Fi, and WAN by using PRTG remote probes.
Paessler PRTG is your all-in-one network monitoring tool. With it, you can keep an eye on the health and performance of your physical and virtual IT, OT, and IoT infrastructures – on premises or in the cloud. Monitor, for example, network devices (servers, switches, routers, firewalls), virtual environments, applications, services, websites, operating systems, network traffic, environmental parameters, entire data centers, resource consumption, and much more.
In PRTG, “sensors” are the basic monitoring elements. One sensor usually monitors one measured value in your network, for example the traffic of a switch port, the CPU load of a server, or the free space on a disk drive. On average, you need about 5-10 sensors per device or one sensor per switch port.
Paessler conducted trials in over 600 IT departments worldwide to tune its network monitoring software closer to the needs of sysadmins. The result of the survey: over 95% of the participants would recommend PRTG – or already have.

Paessler PRTG is used by companies of all sizes. Sysadmins love PRTG because it makes their job a whole lot easier.
Bandwidth, servers, virtual environments, websites, VoIP services – PRTG keeps an eye on your entire network.
Everyone has different monitoring needs. That’s why we let you try PRTG for free.