All-in-one medical
device & healthcare IT
infrastructure monitoring
- Central overview of both your classic IT and healthcare IT in a single monitoring tool
- Performance, availability, and security monitoring of medical devices & hospital routines
- Full support of common standards and protocols used in the healthcare industry
5 reasons why experts monitor healthcare IT with PRTG
Modern hospitals are highly digitalized – and the availability of patient data is at the core of this digitalization. As classic IT systems & healthcare IT are converging, having a central monitoring overview like Paessler PRTG becomes more crucial than ever.
- Get out-of-the-box support for common healthcare IT protocols (DICOM C-ECHO, DICOM C-FIND, HL7)
- Collect monitoring data from modalities, mobile health devices, PACS, HIS, RIS, and more
- Keep an eye on healthcare workflows and hospital processes including data transfer
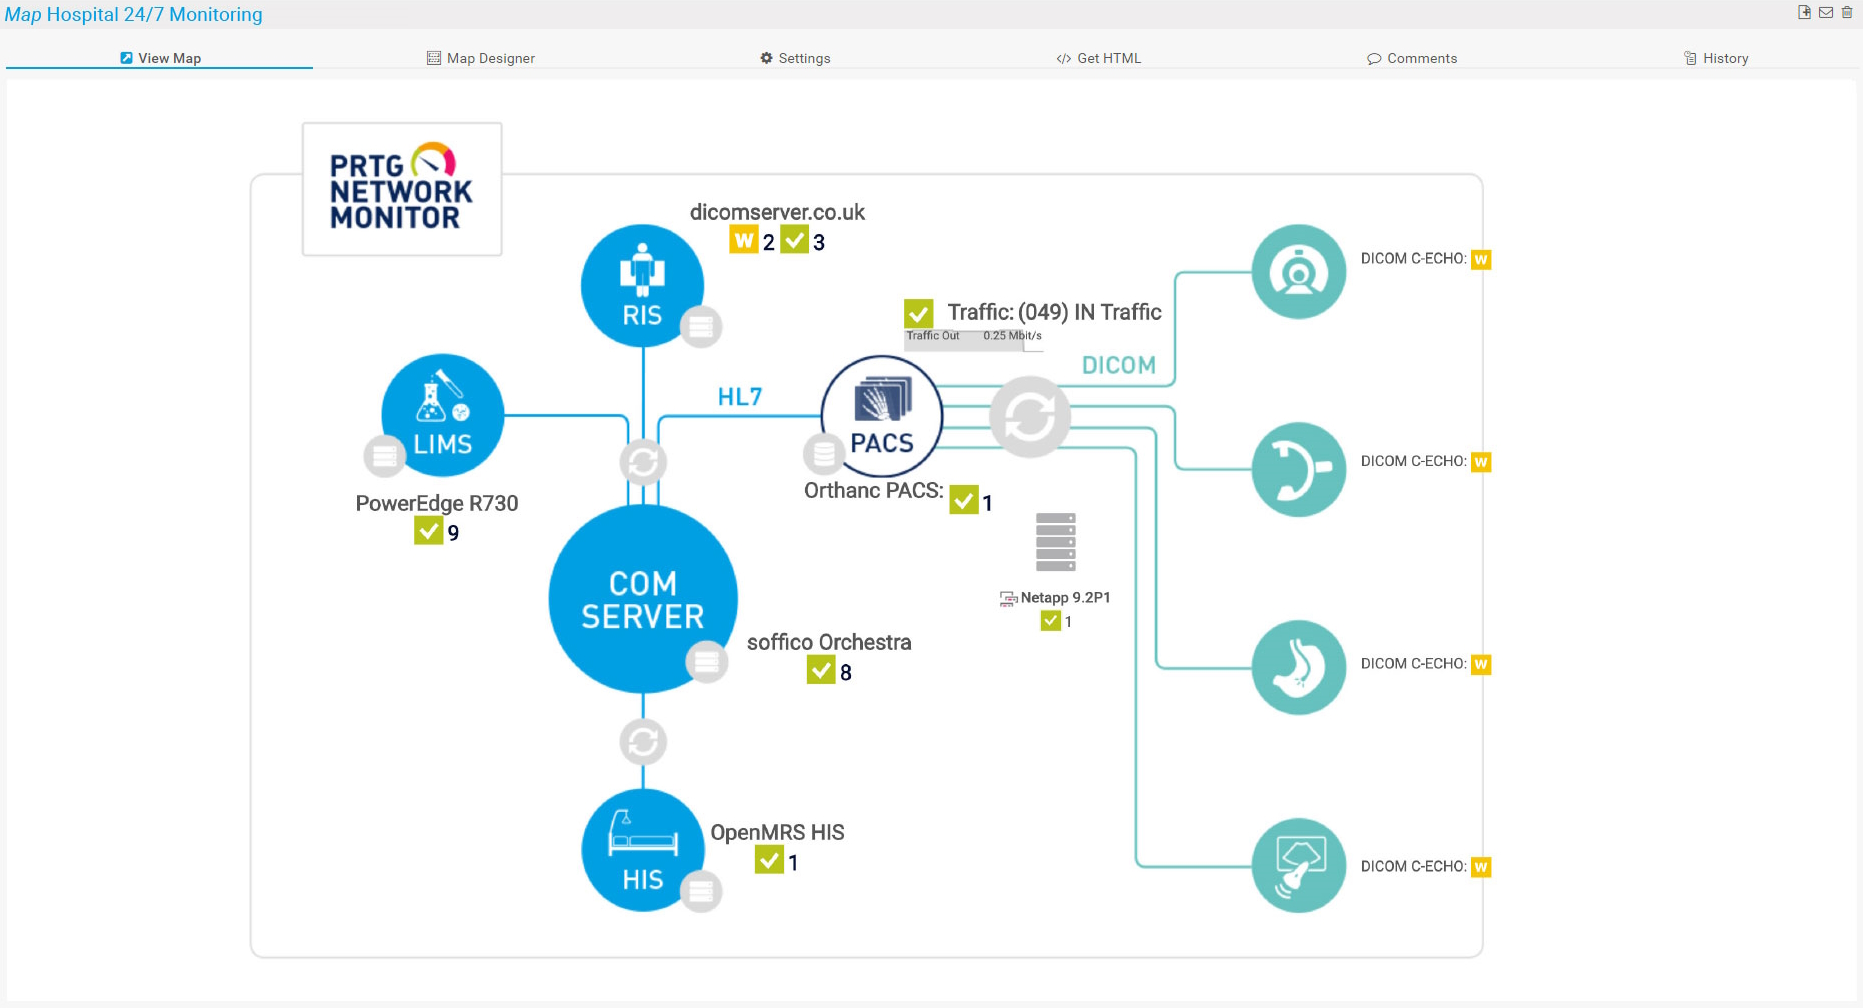
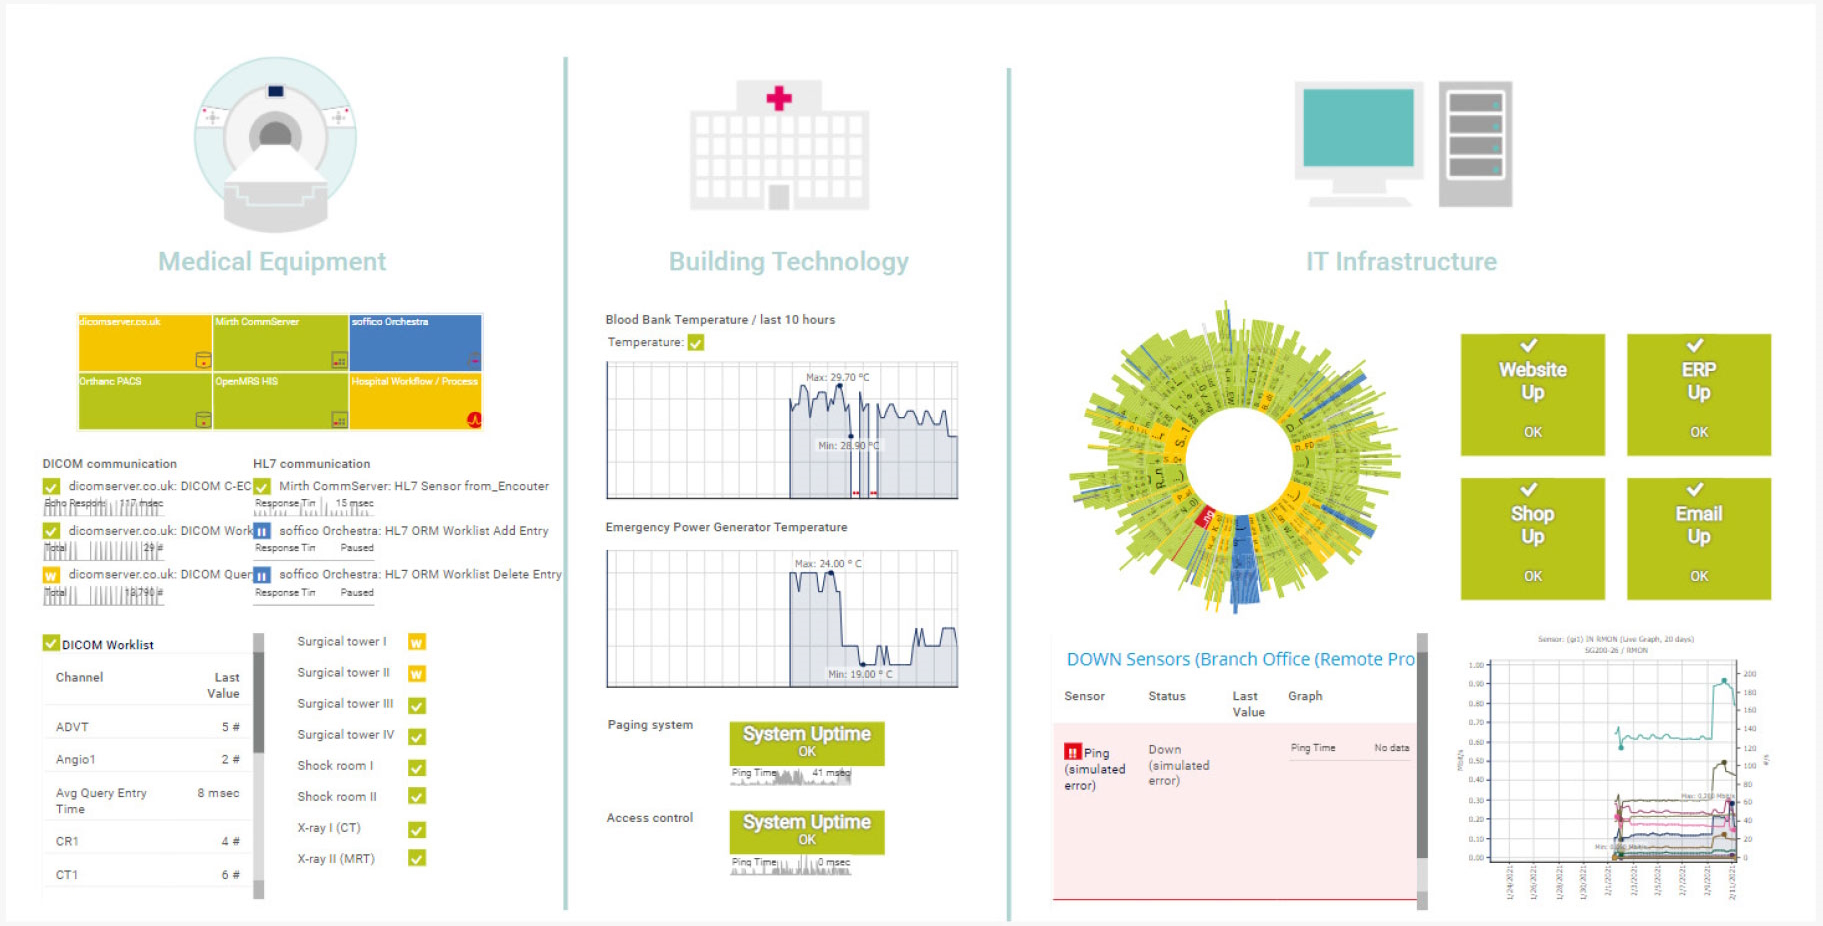
- Visualize your healthcare IT environment in custom dashboards for a central overview
- Extend the functionality of your medical equipment’s built-in monitoring features
Why PRTG is the healthcare IT monitoring tool of your choice
Ensure the security of healthcare data
- Enhance network security by monitoring firewalls, intrusion detection systems & more
- Securely check the transfer of patient data & the involved medical devices via HL7
- Monitor data type, volume, and device state – PRTG has no access to personal data
Monitor both healthcare & classic IT
- Watch not only your medical equipment, but also the underlying IT infrastructure
- Monitor the health of hardware such as switches, servers, and storage systems
- Keep an eye on Wi-Fi usage, access points, and application performance
Receive custom PRTG alerts in real time
- Define warning thresholds to be alerted before a more serious issue occurs
- Set notification triggers to inform the right people at the right time
- Choose from notification methods such as SMS, email, or push notification
Visualize your data in custom dashboards
- Create customized dashboards in HTML format with our drag & drop editor
- Visualize single medical devices, entire hospital floors, or eHealth processes
- Share dashboards on hospital IT center screens or for specific teams only
What healthcare IT monitoring looks like in PRTG
Diagnose issues with your healthcare devices by continuously monitoring your hardware, bandwidth, and availability. Show hospital workflows in real time and visualize data in graphic maps & dashboards to identify problems more easily. Gain the visibility you need to troubleshoot issues with your hospital computers.
Start monitoring your healthcare IT systems & medical devices with PRTG and see how it will make hospital routines easier and the transfer of patient data more secure.
5 use cases for monitoring your digital medical equipment
With PRTG, you get a centralized monitoring solution that is a perfect fit for monitoring both classic IT (servers, databases, computers, email, etc.) and healthcare IT (medical devices, hospital systems, specific technologies).
But what exactly can you monitor in a typical hospital setup, for example? Find out about some use cases for medical monitoring in a healthcare environment.
Watch the Integration Engine
The integration engine is the central communication server of the IT environment. It receives messages from different systems, translates them into formats that other systems can understand, and distributes the messages further via multiple technologies, including HL7, DICOM, Fast Healthcare Interoperability Resources (FHIR) and HTTP-based requests.
Read more
To make sure that the Integration Engine is up and running and processing messages correctly, you should watch the following aspects:
- Hardware: monitor available disk space, memory, CPU load etc.
- Messages: monitor the number of processed messages, errors in the messages etc.
- Latency: monitor the read and write latency to connected databases
Keep an eye on your PACS
The Picture Archive and Communication System, or PACS, is an image sharing platform and as such, a central repository for images generated from devices like MRTs or video endoscopies. These images are stored on the PACS so they can be accessed or transferred by other workstations or devices. To make sure that images are stored and can be accessed correctly, you should keep an eye on different aspects of the PACS.
Read more
These aspects can be:
- Hardware: monitor available disk space, memory, signs of overheating etc.
- Latency: monitor the latency of read and write tasks
- Log files: monitor the number of PACS errors, failed authentication attempts etc.
- Interfaces: monitor availability and responsiveness of workstations that access PACS data
Monitor the different modalities
Modalities refer to healthcare equipment that is used for creating medical images, for example X-ray, Computer Tomography (CT), or Magnetic Resonance Imaging (MRI). Modalities use the DICOM standard to take images, connect to a PACS, and send the images there to store them. Each modality has an associated worklist that contains a list of scheduled jobs as well as patient data.
Read more
To make sure that medical devices are reachable and the data transfer works as expected, you should keep an eye on the following:
- Availability: monitor C-ECHO requests to make sure devices are up & running
- Performance: monitor the response times of C-ECHO requests
- Worklists: monitor the number of worklist items to identify bottlenecks or other issues
- Storage: check for locally stored medical images to identify storage issues with the PACS
Check health information exchange
Digital medical devices, interfaces, and systems don’t run in isolation. Patient data like X-Ray or ultrasound images, laboratory or specialist results, the patient’s history, or details of the patient’s primary care physician are transported via the hospital’s system infrastructure, which consists of different subsystems.
Read more
Examples can be:
- Master patient data is managed via the Hospital Information System (HIS)
- Laboratory data is stored in the Laboratory Information System (LIMS)
- Radiology data is managed via the Radiology Information System (RIS.
All these health information exchange (HIE) systems use different technologies to transfer data. To bring the information from all these systems together, including data transfer and data traffic, you can set up a Business Process sensor in PRTG for each hospital workflow that you want to keep an eye on.
Monitor custom healthcare IT cases
In addition to our preconfigured eHealth sensors, PRTG offers a REST Custom sensor, with which you can practically integrate everything in the healthcare IT sector that you want to monitor via REST API.
Read more
Here are some examples:
- Changes in and issues with electronic documentation, for example on-premises or cloud-based EHRs (Electronic Health Records)
- Service level agreements made with HISPs (health information service providers)
- Availability and status of mobile health (mHealth) devices such as wearable sensors and mobile workstations
- Triggering of reminders and alerts in CDS (clinical decision support) processes
- Business & clinical intelligence applications that are used for financial and operational aspects of healthcare environments
The PRTG advantage: Preconfigured sensors for monitoring your healthcare IT environment
Beyond out-of-the-box support for all classic IT standards, PRTG offers a RESTful API as well as
DICOM and HL7 support. Easily integrate medical devices, mobile health workstations, and healthcare IT communication processes into your monitoring with our preconfigured PRTG sensors.
DICOM Bandwidth
Use the DICOM Bandwidth sensor to monitor the bandwidth usage of a C-STORE request to a device that supports DICOM (Digital Imaging and Communications). The sensor sends one or more DICOM images and files that you have stored in a folder on a local disk or share and checks if the DICOM device can handle the C-STORE request. It can show the following parameters:
- Bandwidth usage of the sent files
- Response time of the C-STORE request
- Total size of the sent files
You can use the sensor to test your PACS, for example.
DICOM C-ECHO
Use the DICOM C-ECHO sensor to monitor the availability of DICOM-capable systems and devices by sending C-ECHO requests to the target system. C-ECHO is also known as DICOM-Ping. The sensor can show the following parameters:
- Average response time of the C-ECHO request
- Maximum response time of the C-ECHO request
- Minimum response time of the C-ECHO request
You can use the sensor to verify that the DICOM handshake is executed and that your target system is capable of answering DICOM messages.
DICOM Query/Retrieve
Use the DICOM Query/Retrieve sensor to monitor the C-FIND capability of DICOM-capable systems and devices. The sensor sends a C-FIND request or Modality Worklist (MWL) query to the target device and counts all found items. It can show the following parameters:
- Average query entry time
- Minimum and maximum query entry time
- Total number of items found
- Total time of the C-FIND request or MWL query
Soffico Orchestra Channel Health
Use the Soffico Orchestra Channel Health sensor to monitor the state and the overall number of successful or unsuccessful channel calls. The sensor can show the following parameters:
- Adapter status
- Number of errors
- Number of OKs
You can use the sensor, for example, if you use a soffico Orchestra server as your Integration Engine.
Start monitoring your healthcare IT systems & medical devices with PRTG and see how it will make hospital routines easier and the transfer of patient data more secure.
“With these sensors, we have have a close view on the current device status of, for example, MRTs, CTs, ultrasound devices and video endoscopes. We monitor the most unstable link in a chain of DICOM routers. As soon as PRTG raises the alarm, we know that we have to intervene.”
Stefan Theisel, IT employee at the Jena University Hospital
Monitor healthcare IT: Get your free white paper
This white paper introduces Paessler PRTG as a complete and reliable solution for monitoring your healthcare IT systems.
Get an overview of what a typical healthcare IT environment looks like and which standards and protocols are used; and learn about the challenges that IT professionals in the healthcare sector face and how PRTG can help them overcome these challenges.
Success stories from our customers
Companies around the world trust Paessler PRTG when it comes to ensuring that their IT systems run smoothly.
HammondCare uses Paessler PRTG for proactively monitoring its IT infrastructure
HammondCare is a not-for-profit independent aged care and health services provider for residential care, home care, community health and hospital care. It monitors the IT infrastructure at their 76 sites with the use of Paessler PRTG to be able to respond proactively to incidents rather than awaiting site-based staff to report problems, which previously took hours and resulted in greater business outages.
The Austrian Red Cross not only saves lives but also resources with Paessler PRTG
The Red Cross needs a steady flow of blood reserves to be able to save lives. In Austria, this blood is collected, managed, and distributed at the Red Cross Blood Donation Center in Linz. To promptly detect errors (and prevent potential damage and failures), the responsible IT team keeps a constant eye on the availability and performance of the entire IT infrastructure with the help of Paessler PRTG.
How the LUMC can monitor all its IT systems thanks to Paessler PRTG
LUMC is a modern university medical center for research, education and patient care with a high-quality profile and a strong scientific orientation. LUMC chose Paessler PRTG because of its ability to monitor medical equipment as well as the health of the entire network 24 hours a day and also, by extension, the health of the patients.
Create innovative solutions with Paessler’s partners
Partnering with innovative vendors, Paessler unleashes synergies to create
new and additional benefits for joined customers.
Asset visibility is a big problem for many IT teams. Not having an accurate inventory of tech assets is inefficient, costly and a potential security risk.
Lansweeper
Healthcare IT monitoring: FAQ
1. What is healthcare IT monitoring?
Healthcare IT monitoring refers to the practice of overseeing and tracking the performance, availability, and security of information technology systems and applications within the healthcare industry. It involves the continuous monitoring of various components and processes related to IT infrastructure and software applications used in healthcare settings, such as hospitals, clinics, and healthcare organizations.
One of the main goals of healthcare IT monitoring is to enable healthcare providers to deliver high-quality care to patients and to contribute to the delivery of effective patient care and the protection of sensitive patient data.
2. What does healthcare IT monitoring software do?
Healthcare IT monitoring software refers to specialized software solutions designed to monitor, manage, and analyze the performance, availability, and security of healthcare IT systems. These software tools provide healthcare organizations with the means to proactively monitor their IT infrastructure, identify issues, and ensure the smooth operation of critical systems.
3. Which features should healthcare IT monitoring tools include?
Healthcare IT monitoring tools should include the following features, among others:
- Performance monitoring: Monitoring the performance metrics of hardware, networks, servers, databases, and software applications to ensure optimal functioning. This includes tracking response times, resource utilization, and other performance indicators.
- Availability monitoring: Ensuring that IT systems and applications are available and accessible to users as expected. This involves monitoring network connectivity, server uptime, and the availability of critical services.
- Security monitoring: Monitoring and detecting potential security threats, vulnerabilities, or breaches in the IT infrastructure. This includes activities such as log analysis, intrusion detection, and identifying unusual or unauthorized access attempts.
- Compliance and audit support: Features to assist with compliance monitoring and adherence to regulatory requirements, such as HIPAA (Health Insurance Portability and Accountability Act). The software may offer audit trails, data privacy controls, and reporting capabilities to support compliance efforts.
- Integration and scalability: The ability to integrate with existing healthcare IT systems, electronic health records (EHR), and other relevant applications using standards and protocols typical for the healthcare industry, such as DICOM or HL7. The software should be scalable to accommodate the growth and changing needs of the healthcare organization.
4. What is a sensor in PRTG?
In PRTG, “sensors” are the basic monitoring elements. One sensor usually monitors one measured value in your network, for example the traffic of a switch port, the CPU load of a server, or the free space on a disk drive.
On average, you need about 5-10 sensors per device or one sensor per switch port.
Get more deep-dive information about monitoring healthcare IT
Keep your healthcare IT healthy with PRTG: DICOM & HL7 sensors
Read about the preconfigured DICOM and HL7 sensors that come with PRTG out-of-the-box and what exactly you can monitor with these sensors.
Free webinar: Monitor your healthcare IT the easy way
Watch this free webinar where we discuss challenges related to healthcare IT and show you typical use cases of how to monitor digitalized medical equipment and healthcare workflows.
Learn how to monitor healthcare IT with PRTG: Tutorial videos
In this blog post, we share some tutorial videos that show you exactly how to set up our PRTG healthcare IT sensors and tell you more about the information that they deliver to you.
Start monitoring your healthcare IT systems & medical devices with PRTG and see how it will make hospital routines easier and the transfer of patient data more secure.
Combining the broad monitoring feature set of PRTG with IP Fabric’s automated network assurance creates a new level of network visibility and reliability.