UCaaS monitoring with PRTG
Gain a unified view of your unified communications
- Monitor key UCaaS components' health stats from one place
- Get automatically alerted of poor network performance or disruption
- Monitor Microsoft Teams, Zoom, Cisco Webex, and other leading service providers
PRTG UCaaS monitoring: What you’ll find on this page
- So you've conquered your communications Tower of Babel… now what?
- 4 reasons why to choose PRTG as your UCaaS monitoring tool
- What UCaaS monitoring looks like in PRTG
- No more unified communications breakdowns: PRTG UCaaS monitoring in action
- Explore our preconfigured PRTG sensors for UCaaS monitoring
- Monitoring UCaaS: FAQ
So you've conquered your communications Tower of Babel… now what?
UCaaS platforms – unified communications as a service – make things simpler for many reasons. They streamline communications (and workflows) for end-users, give you more flexibility, and enable you to add and remove users without major infrastructural changes, just to name three.
But that doesn't mean you can set up a UCaaS platform and forget it. Issues like high bandwidth usage, latency, jitter, and packet loss can still lead to a poor user experience (and very frustrated colleagues).
And, while cloud delivery mechanisms are designed to be as stable and reliable as possible, disruption can and does happen.
Paessler PRTG brings together all your critical communication health stats in one place. You'll have a unified, real-time view of your UCaaS stack. More importantly, you can keep a close eye on key metrics even when you're not looking, and avoid nasty surprises that could slow your organization down or make it impossible for your colleagues to do their jobs.
PRTG makes UCaaS monitoring as easy as it gets
Custom alerts and data visualization let you quickly identify and prevent high latency, availability issues, service disruptions, and other causes of poor user experience and performance.
4 reasons why to choose PRTG as your UCaaS monitoring tool
Real-time monitoring
Continuously track every critical element of your unified communications from one place: bandwidth usage, VoIP and QoS parameters… we even have sensors that work out how much you're spending on AWS and Microsoft Azure, so you can keep costs under control.
Automatic alerts
Prevent disruption on your UCaaS platform... and your entire network. Pick your preferred thresholds, and PRTG will alert you if there’s a risk of malfunctions or performance issues, so you can maintain the user experience and enable your colleagues to keep working smoothly.
Proactive planning
Don't let end-users get interrupted in the middle of important meetings. Carry out application performance monitoring round the clock, and pick the software that's least likely to malfunction in the middle of a business-critical discussion or presentations.
Reduced workload
Work smarter, not harder. And by that we mean let PRTG handle everything and get on with more important tasks. The Auto-Discovery makes setting up a breeze. Once you're up and running, PRTG works in the background 24/7, giving you the peace of mind your UCaaS stack is taken care of.
What UCaaS monitoring looks like in PRTG
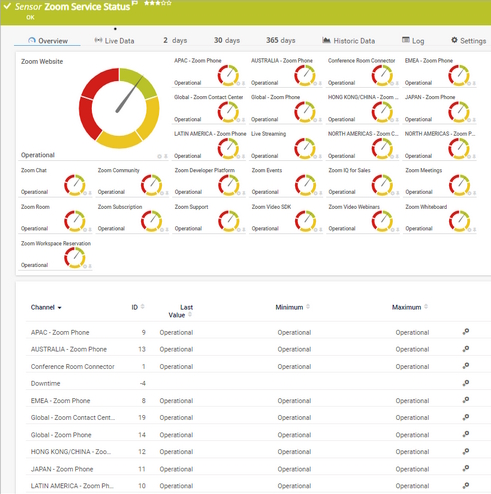
Diagnose network issues by continuously tracking various UCaaS parameters and components. Show response time, bandwidth usage, VoIP traffic, latency, packet loss, jitter, and other key QoS metrics in real time. Visualize monitoring data in clear graphs and dashboards to identify problems more easily. Gain the overview you need to troubleshoot all kinds of unified communications-related issues.
Start monitoring UCaaS with PRTG and see how it can make your network more reliable and your job easier.
No more unified communications breakdowns: PRTG UCaaS monitoring in action
Monitor unified communications apps, audio, video conferences, software… and your network's wider performance.
PRTG's preconfigured UCaaS monitoring sensors can keep an eye on every component and endpoint that could impact the quality of communications and your colleagues' user experience:
- Bandwidth and network traffic analysis via SNMP, NetFlow, jFlow, sFlow, IPFIX, and packet sniffing
- Email communications and mail servers, including Microsoft Exchange
- LAN, WAN, VPNs, and Direct Access
- IP telephony and video conferencing tools like Microsoft Teams, Zoom, Cisco Webex, Join.me, Skype for Business, or RingCentral
- Microsoft 365 applications, SharePoint, and PowerApps
- Unified communications-adjacent cloud network components
Your UCaaS monitor at a glance – even on the go
Set up PRTG in minutes and use it on almost any mobile device.


Find the root cause of the problem with our PRTG UCaaS monitoring solution
Real-time notifications mean faster troubleshooting so that you can act before more serious issues occur.
PRTG is compatible with all major vendors, products, and systems
Explore our preconfigured PRTG sensors for UCaaS monitoring
PRTG comes with more than 250 native sensor types for monitoring your entire on-premises, cloud, and hybrid cloud environment out of the box. Check out some examples below!
Create innovative solutions with Paessler’s partners
Partnering with innovative vendors, Paessler unleashes synergies to create
new and additional benefits for joined customers.
ScriptRunner
With ScriptRunner, Paessler integrates a powerful event automation platform into PRTG Network Monitor.
“Excellent tool for detailed monitoring. Alarms and notifications work greatly. Equipment addition is straight forward and server initial setup is very easy. ...feel safe to purchase it if you intend to monitor a large networking landscape.”
Infrastructure and Operations Engineer in the Communications Industry, firm size 10B - 30B USD
PRTG makes UCaaS monitoring as easy as it gets
Custom alerts and data visualization let you quickly identify and prevent high latency, availability issues, service disruptions, and other causes of poor user experience and performance.

PRTG: The multi-tool for sysadmins
Adapt PRTG individually and dynamically to your needs and rely on a strong API:- HTTP API: Access monitoring data and manipulate monitoring objects via HTTP requests
- Custom sensors: Create your own PRTG sensors for customized monitoring
- Custom notifications: Create your own notifications and send action triggers to external systems
- REST Custom sensor: Monitor almost everything that provides data in XML or JSON format
We asked: would you recommend PRTG?
Over 95% of our customers say yes!
Paessler conducted trials in over 600 IT departments worldwide to tune its network monitoring software closer to the needs of sysadmins.
The result of the survey: over 95% of the participants would recommend PRTG – or already have.
Still not convinced?
More than 500,000
sysadmins love PRTG
Paessler PRTG is used by companies of all sizes. Sysadmins love PRTG because it makes their job a whole lot easier.
Monitor your entire IT infrastructure
Bandwidth, servers, virtual environments, websites, VoIP services – PRTG keeps an eye on your entire network.
Try Paessler PRTG
for free
Everyone has different monitoring needs. That’s why we let you try PRTG for free.
Start monitoring UCaaS with PRTG and see how it can make your network more reliable and your job easier.
|
PRTG |
Network Monitoring Software - Version 25.2.106.1114 (May 6th, 2025) |
|
Hosting |
Download for Windows and cloud-based version PRTG Hosted Monitor available |
Languages |
English, German, Spanish, French, Portuguese, Dutch, Russian, Japanese, and Simplified Chinese |
Pricing |
Up to 100 sensors for free (Price List) |
Unified Monitoring |
Network devices, bandwidth, servers, applications, virtual environments, remote systems, IoT, and more |
Supported Vendors & Applications |
|
Discover more monitoring insights and stories
Solutions for all your monitoring needs
Powerful stories from the monitoring world


