sFlow monitoring with PRTG
Low-resource sFlow analysis for high-traffic networks
- Monitor all your sFlow data from one place
- Get alerted promptly in case of performance issues
- Works with any sFlow-compatible device
PRTG sFlow monitoring: What you’ll find on this page
PRTG makes sFlow monitoring as easy as it gets
Custom alerts and data visualizations let you quickly identify and prevent traffic bottlenecks, packet loss, and other network performance issues.
Go with the sFlow
If you're running a busy network, monitoring traffic flow data can feel like trying to count every single car passing through an intersection at high-speed during rush hour. Chances are, instead of helping it work more efficiently, the juice you need to power your monitoring software might end up contributing to it crashing.
Paessler PRTG's sFlow monitoring packs the depth of capabilities you'd expect from a top-of-the-range tool in a low-resource, easy-to-use, scalable solution. Keep an eye on network performance stats, use traffic analysis, troubleshoot issues, and make sure traffic keeps flowing freely, without straining your already limited resources.
3 reasons to use PRTG as your sFlow monitoring tool
Comprehensive solution
No more fiddling about with standalone sFlow collectors, viewers, and analyzers. PRTG is your comprehensive network monitoring tool, giving you a single, unified view.
Plus, it works with any sFlow-compatible device, including devices made by Alcatel-Lucent Enterprise, Cisco, Dell, HPE, and Netgear.
Continuous monitoring
Keep an eye on your network 24 hours a day, 7 days a week. PRTG doesn't take holidays, sick days, or sleep breaks.
Which means you can do so, safe in the knowledge PRTG automatically alerts you about network problems and protocol errors by email, push notification, SMS, and other methods – often before costly failures occur.
Effortless optimization
Keeping your network in top shape has never been easier. PRTG puts key performance stats at your fingertips, empowering you to allocate resources more efficiently, improve security, and make short work of any issues that are draining your resources.
Easily detect, for example, bandwidth bottlenecks, reduce unnecessary traffic, and accelerate business processes and maximize service availability through bandwidth optimization.
What sFlow monitoring looks like in PRTG
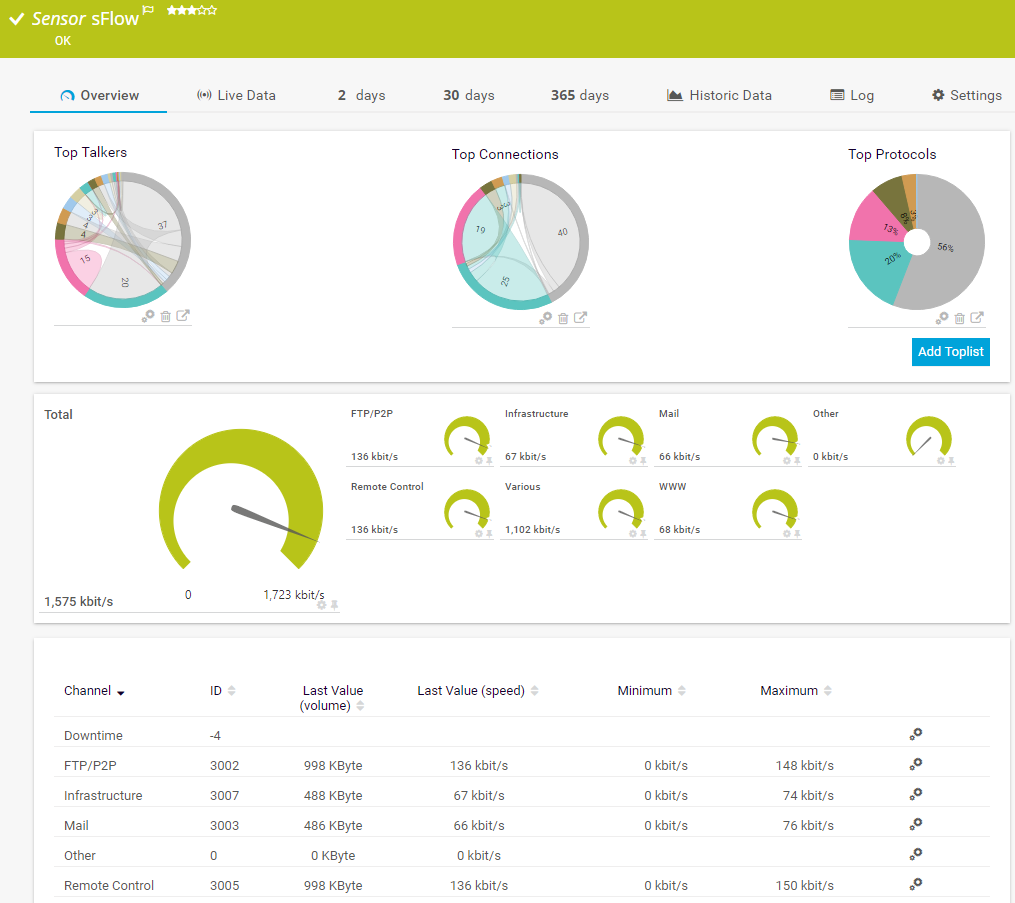
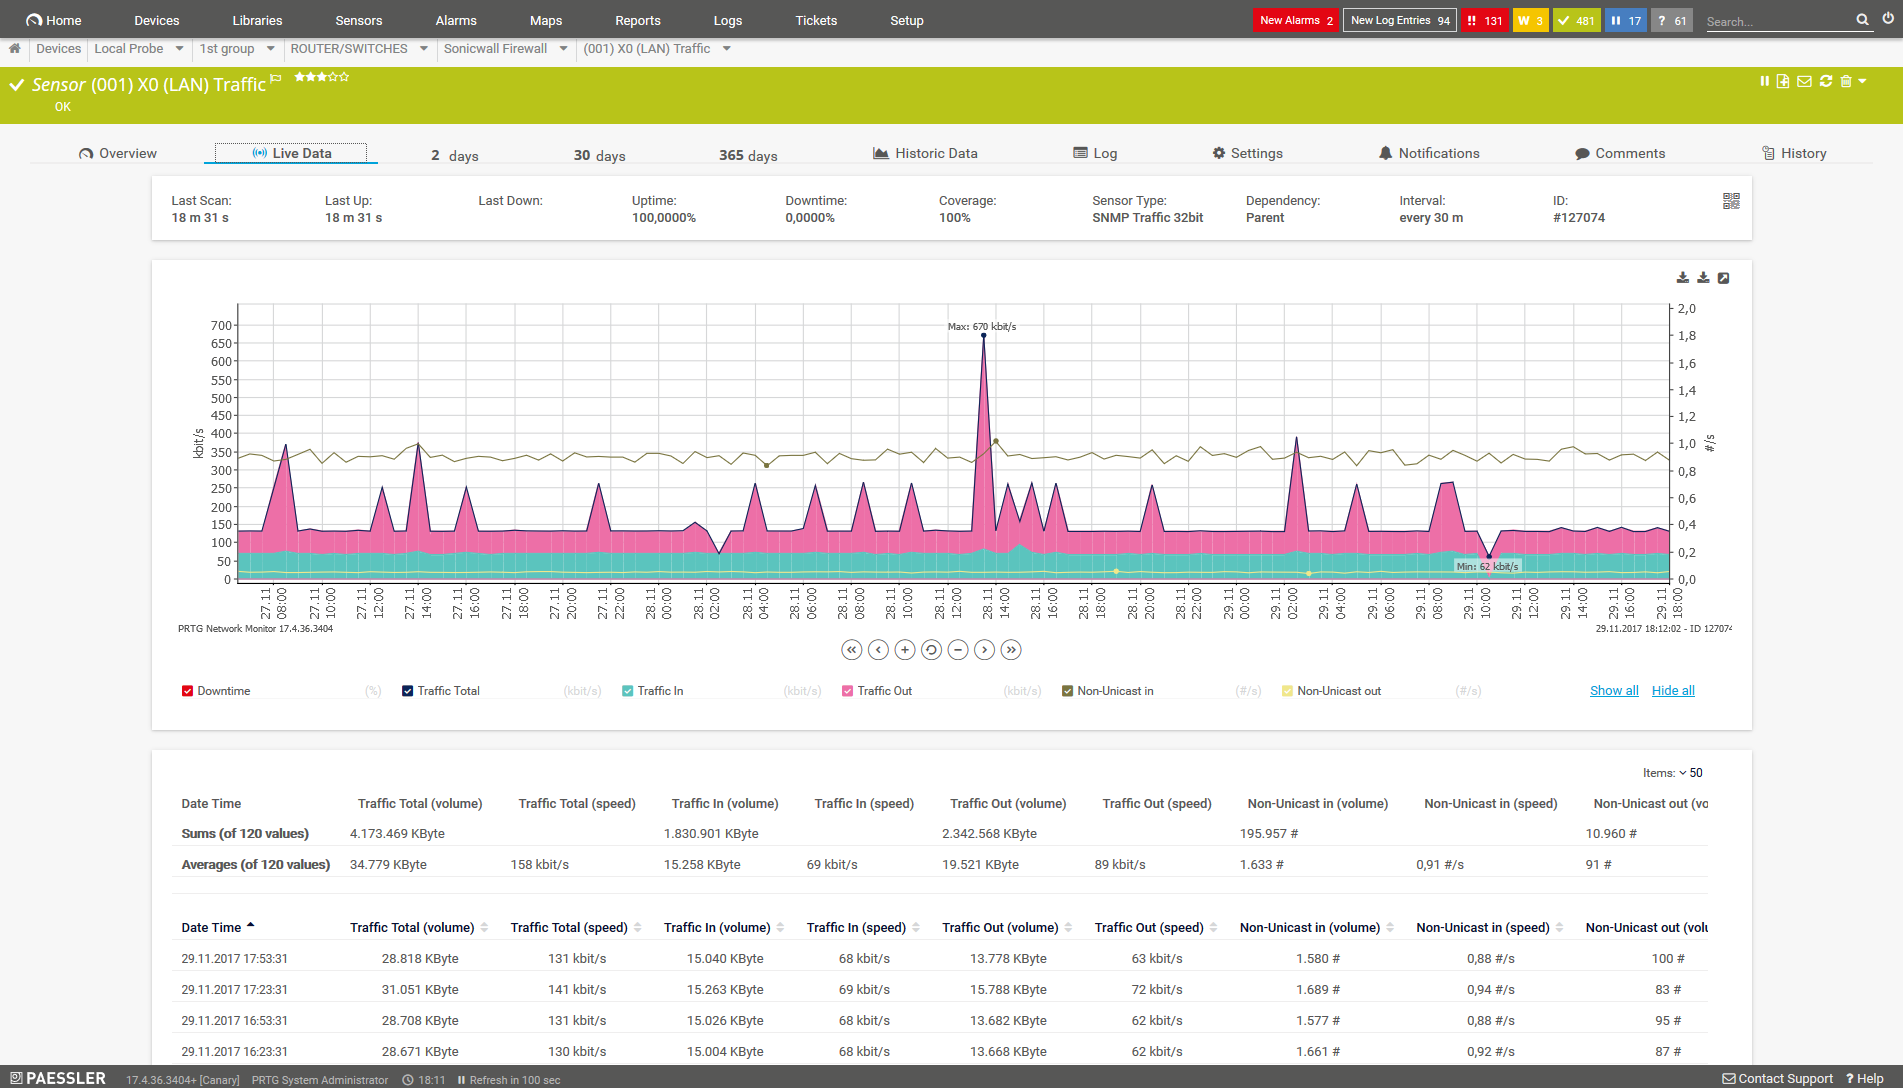
Diagnose network issues by continuously tracking bandwidth usage, data traffic, and other network activities. Show bandwidth eaters by IP address (IPv4 or IPv6) or port number, dropped sFlow packets, corrupted packet headers, and other key metrics in real time. Visualize monitoring data in clear graphs and dashboards to identify problems more easily. Gain the overview you need to troubleshoot performance problems and routing issues, and optimize your network.
Start sFlow monitoring with PRTG and see how it can make your network more reliable and your job easier.
How it works: sFlow monitoring with PRTG in action
PRTG's sophisticated, preconfigured flow sensor types show you the following key pieces of data:
Bandwidth use per individual connection, and across the entire network
Root causes of traffic filtered by IP address, port, and protocol
Toplists that show you the main sources of traffic on your network over time
PRTG is compatible with all major vendors, products, and systems
Your sFlow monitor at a glance – even on the go
Set up PRTG in minutes and use it on almost any mobile device.


Find the root cause of the problem with our PRTG sFlow monitoring solution
Real-time notifications mean faster troubleshooting so that you can act before more serious issues occur.
Create innovative solutions with Paessler’s partners
Partnering with innovative vendors, Paessler unleashes synergies to create
new and additional benefits for joined customers.
UVnetworks
UVexplorer integrates tightly with PRTG to bring fast and accurate network discovery, detailed device inventory, and automatic network mapping to the PRTG platform.
“Excellent tool for detailed monitoring. Alarms and notifications work greatly. Equipment addition is straight forward and server initial setup is very easy. ...feel safe to purchase it if you intend to monitor a large networking landscape.”
Infrastructure and Operations Engineer in the Communications Industry, firm size 10B - 30B USD
PRTG makes sFlow monitoring as easy as it gets
Custom alerts and data visualizations let you quickly identify and prevent traffic bottlenecks, packet loss, and other network performance issues.

PRTG: The multi-tool for sysadmins
Adapt PRTG individually and dynamically to your needs and rely on a strong API:- HTTP API: Access monitoring data and manipulate monitoring objects via HTTP requests
- Custom sensors: Create your own PRTG sensors for customized monitoring
- Custom notifications: Create your own notifications and send action triggers to external systems
- REST Custom sensor: Monitor almost everything that provides data in XML or JSON format
More than just a monitoring tool:
Reasons our customers love PRTG


Still not convinced?
More than 500,000
sysadmins love PRTG
Paessler PRTG is used by companies of all sizes. Sysadmins love PRTG because it makes their job a whole lot easier.
Monitor your entire IT infrastructure
Bandwidth, servers, virtual environments, websites, VoIP services – PRTG keeps an eye on your entire network.
Try Paessler PRTG
for free
Everyone has different monitoring needs. That’s why we let you try PRTG for free.
Start sFlow monitoring with PRTG and see how it can make your network more reliable and your job easier.
|
PRTG |
Network Monitoring Software - Version 25.1.104.1961 (April 7th, 2025) |
|
Hosting |
Download for Windows and cloud-based version PRTG Hosted Monitor available |
Languages |
English, German, Spanish, French, Portuguese, Dutch, Russian, Japanese, and Simplified Chinese |
Pricing |
Up to 100 sensors for free (Price List) |
Unified Monitoring |
Network devices, bandwidth, servers, applications, virtual environments, remote systems, IoT, and more |
Supported Vendors & Applications |
|


Combining the broad monitoring feature set of PRTG with IP Fabric’s automated network assurance creates a new level of network visibility and reliability.