Custom alerts and data visualization let you quickly identify and prevent service outages.
If you’re providing IT services, whether it is in-house to your end users or to customers as a managed service provider, you need to constantly know the status of those services. With Paessler PRTG, you get a set of monitoring tools to ensure the smooth operation of your critical services.
Often, IT services are made of several building blocks and dependencies. With PRTG, you can monitor services at a high level, or you can get an overview of the health and status of each of the components that make up the service.
PRTG gives you the functionality to monitor services of all kinds. From your on-premises Windows servers and applications to your cloud infrastructure and APIs, PRTG provides a comprehensive view of your entire IT service landscape.
Monitoring services with PRTG over time gives you insights into trends and patterns that can help identify recurring issues, predict potential downtime, and optimize infrastructure for maximum uptime.
Configure thresholds in PRTG to trigger alerts when there are issues with your services, like downtime or slow response times. Or get warning notifications even before problems occur, meaning you can take corrective action even before user experience is impacted.
Diagnose network issues by continuously tracking services. Show response times and other key metrics in real time. Visualize monitoring data in clear graphs and dashboards to identify problems more easily. Gain the overview you need to troubleshoot service issues.

Live traffic data graph in PRTG

Device tree view of the complete monitoring setup

Custom PRTG dashboard for keeping an eye on the entire IT infrastructure
Live traffic data graph in PRTG
Device tree view of the complete monitoring setup
“All-around winning
network monitor”
“The real beauty of PRTG is the endless possibilities it offers”
“PRTG Network Monitor
is very hard to beat”
Here are some services PRTG monitors as part of its infrastructure monitoring functionality.
Ensure websites and online applications are always available and performing as expected. PRTG provides key metrics like availability, connection times, load times, performance metrics and more.
Monitor the availability and performance of your cloud services, regardless of the provider. Make sure the cloud services are up, check for bandwidth bottlenecks, and monitor cloud service performance.
Monitor all your applications, whether they reside on physical hardware or virtualized environments. From monitoring response time through to application performance monitoring, get all the application metrics you need.
With support for Oracle SQL, Microsoft SQL, MySQL, PostgreSQL and more, PRTG helps ensure your databases are always available and operating at optimal performance.
PRTG comes with more than 250 native sensor types for monitoring your entire on-premises, cloud, and hybrid cloud environment out of the box. Check out some examples below!
The SMTP sensor monitors a mail server using the Simple Mail Transfer Protocol (SMTP). It can show the following:
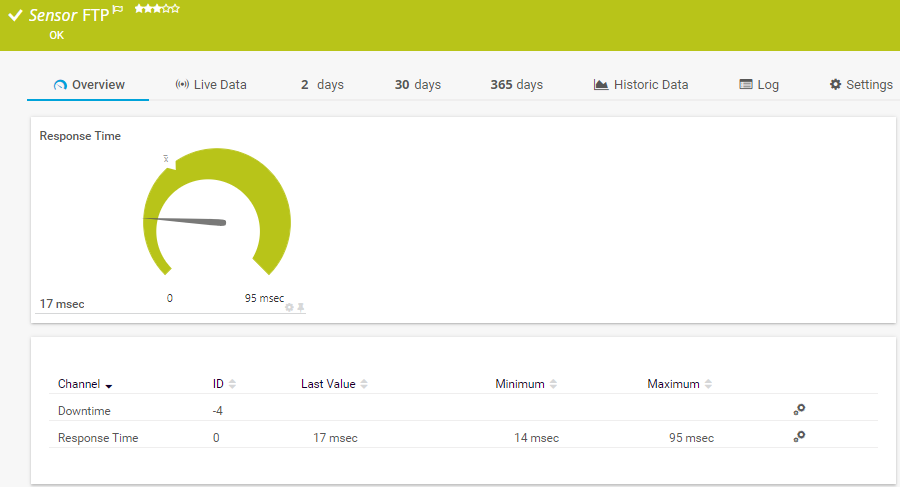
The FTP sensor monitors file servers via the File Transfer Protocol (FTP) and FTP over SSL (FTPS). It can show the following:
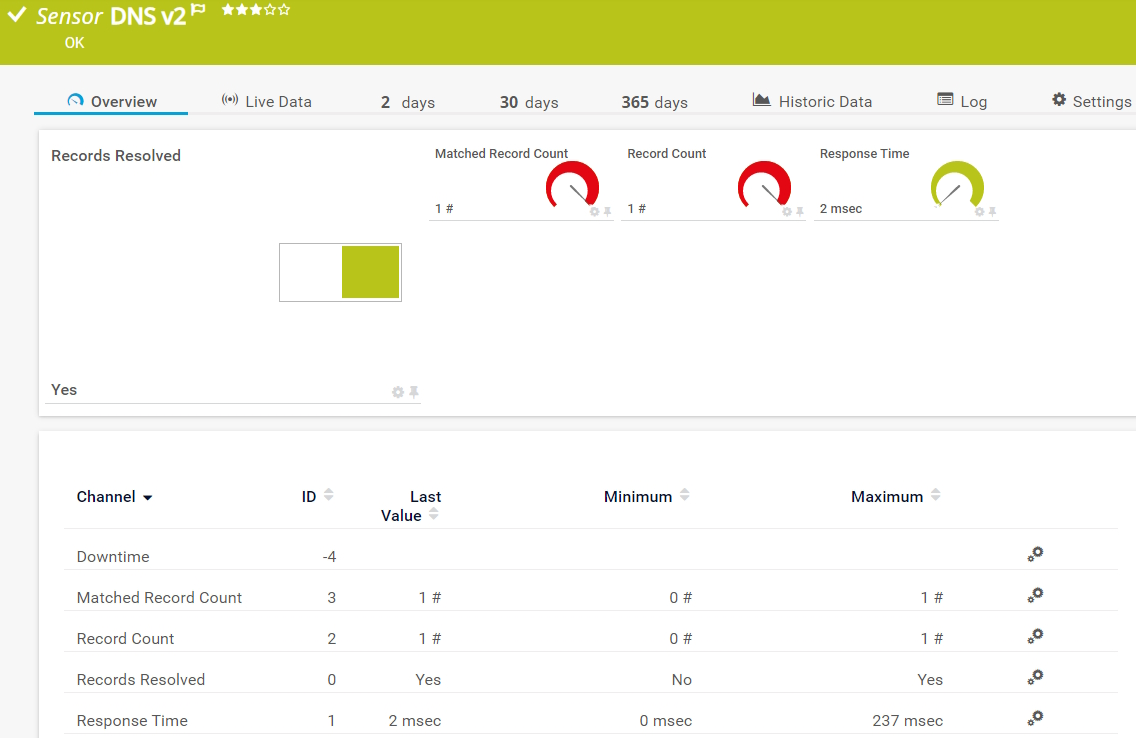
The DNS v2 sensor monitors a Domain Name System (DNS) server, resolves domain name records, and compares them to a filter. It can show the following:
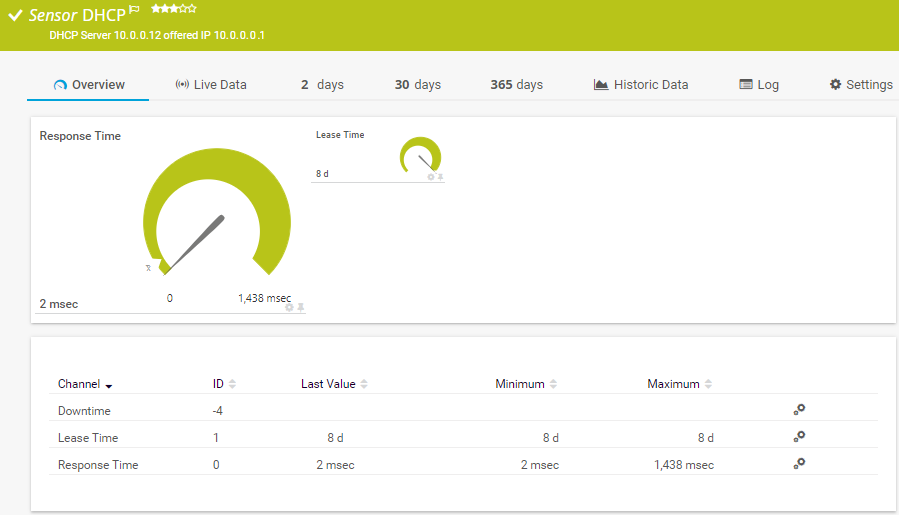
The DHCP sensor monitors a Dynamic Host Configuration Protocol (DHCP) server. It sends a broadcast message to the network and waits for a DHCP server to respond. It can show the following:
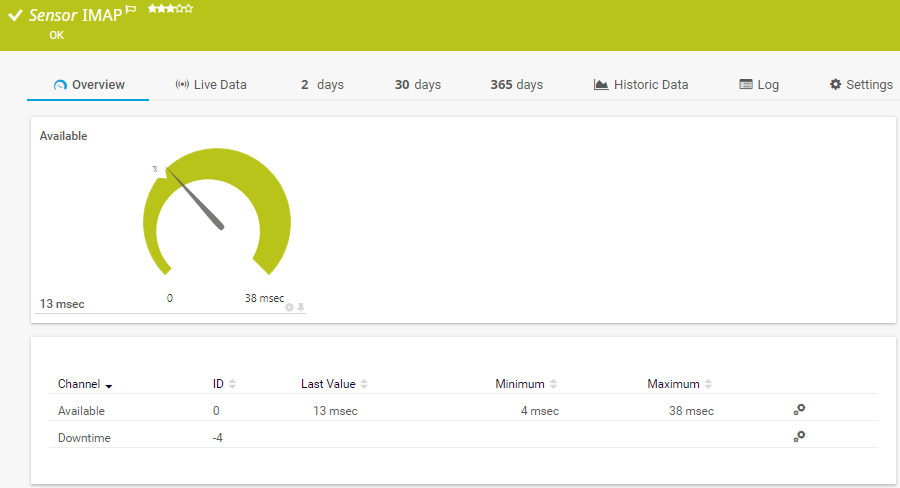
The IMAP sensor monitors an email server via the Internet Message Access Protocol (IMAP). It checks the content of emails for certain keywords. It can show the following:
See the PRTG Manual for a list of all available sensor types.

Custom alerts and data visualization let you quickly identify and prevent service outages.
PRTG is set up in a matter of minutes and can be used on a wide variety of mobile devices.

Partnering with innovative IT vendors, Paessler unleashes synergies to create
new and additional benefits for joined customers.

With the combination of PRTG and Insys, the monitoring specialist Paessler and the industrial gateway manufacturer INSYS icom offer a practical possibility to merge IT and OT.
IT that works constitutes a business-critical basis for a company's success. Availability and security must be defined for the respective purpose and closely monitored – by OT and IT alike.

Siemon and Paessler bring together intelligent building technology and advanced monitoring and make your vision of intelligent buildings and data centers become reality.
Real-time notifications mean faster troubleshooting so that you can act before more serious issues occur.
Network Monitoring Software – Version 24.4.102.1351 (November 12th, 2024)
Download for Windows and cloud-based version PRTG Hosted Monitor available
English, German, Spanish, French, Portuguese, Dutch, Russian, Japanese, and Simplified Chinese
Network devices, bandwidth, servers, applications, virtual environments, remote systems, IoT, and more
Choose the PRTG Network Monitor subscription that's best for you
IT service monitoring is the ongoing process of tracking the performance, availability, and overall health of your IT services. This includes a wide range of components, from your network infrastructure and servers to applications, databases, and even user endpoints.
A robust monitoring system provides the insights needed to ensure your services are running smoothly and meeting performance expectations. This data allows for proactive problem detection, performance optimization, and helps you improve your service management.
PRTG utilizes a variety of methods to monitor your IT services, ensuring comprehensive coverage and compatibility with diverse technologies. It uses pre-configured and customizable sensors to collect data on various metrics, such as availability, performance, usage and more. It utilizes various protocols and technologies, like SNMP, WMI, performance counters, API monitoring, and much more.
In PRTG, “sensors” are the basic monitoring elements. One sensor usually monitors one measured value in your network, for example the traffic of a switch port, the CPU load of a server, or the free space on a disk drive. On average, you need about 5-10 sensors per device or one sensor per switch port.
Paessler conducted trials in over 600 IT departments worldwide to tune its network monitoring software closer to the needs of sysadmins. The result of the survey: over 95% of the participants would recommend PRTG – or already have.

Paessler PRTG is used by companies of all sizes. Sysadmins love PRTG because it makes their job a whole lot easier.
Bandwidth, servers, virtual environments, websites, VoIP services – PRTG keeps an eye on your entire network.
Everyone has different monitoring needs. That’s why we let you try PRTG for free.