PRTG Manual: Compare Sensors
Important Notice |
|---|
This feature is deprecated. We have completely removed it from PRTG with version 17.4.35. If you want to compare sensors, please use PRTG Desktop instead. |
This function allows you to compare the graphs of any two or more sensors, regardless of their type. The selected graphs are displayed within one window, so you can have a look at all of them at the same time and visually compare them.
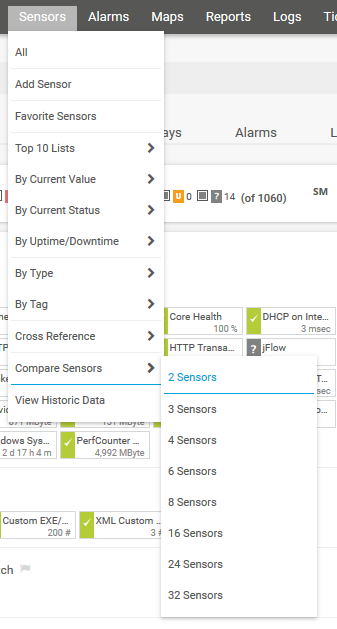
To compare graphs of several sensors, select Sensors | Compare Sensors from the main menu bar. Hover over it and select how many sensors you want to compare.

PRTG Main Menu: Compare Sensors
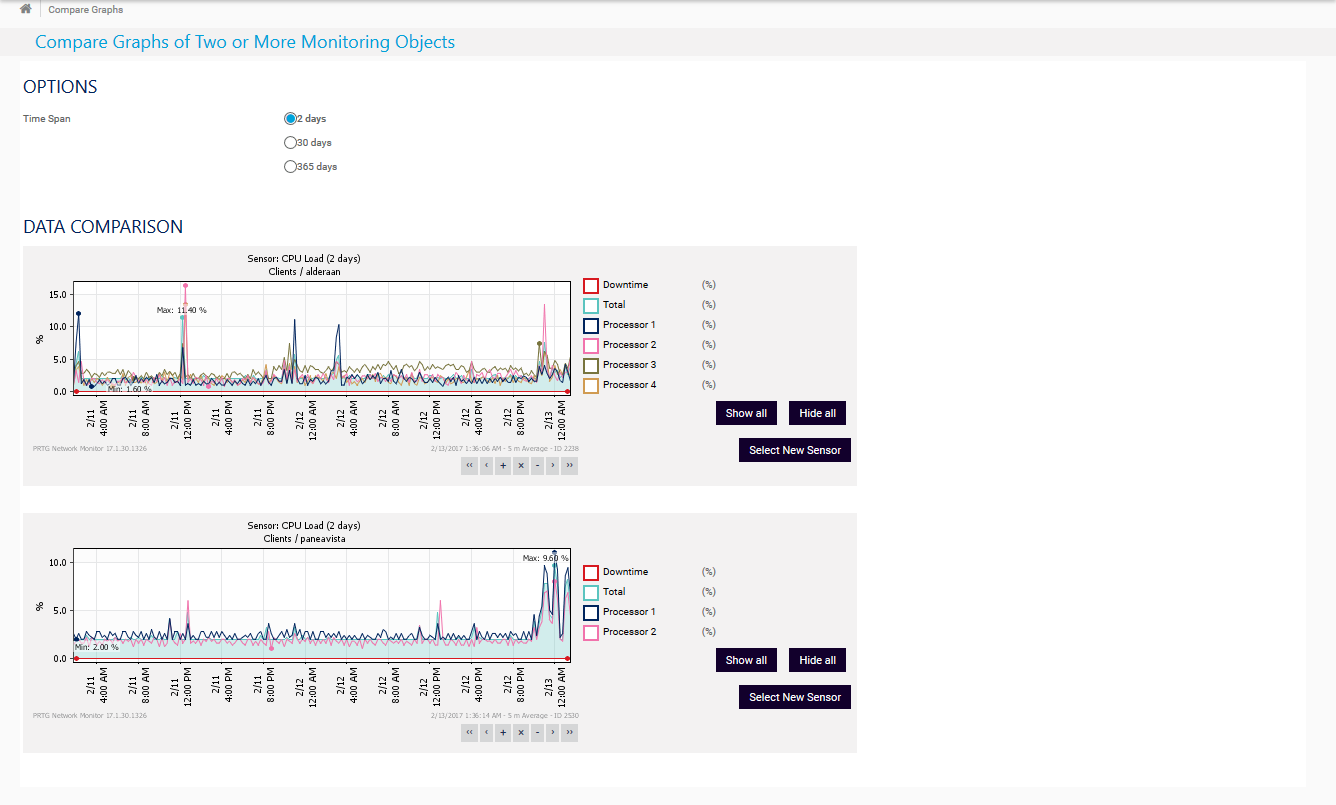
Choose the number of sensors that you wish to compare. This opens an assistant where you can choose your desired sensors and the time span the particular graphs will cover.

Compare Graphs of Two Sensors with 2 Days Time Span
Click here to enlarge: https://media-s3.paessler.com/prtg-screenshots/compare_graphs2.png
Options |
|
|---|---|
Time Span |
Specify the time span the graphs should cover:
|
Data Comparison
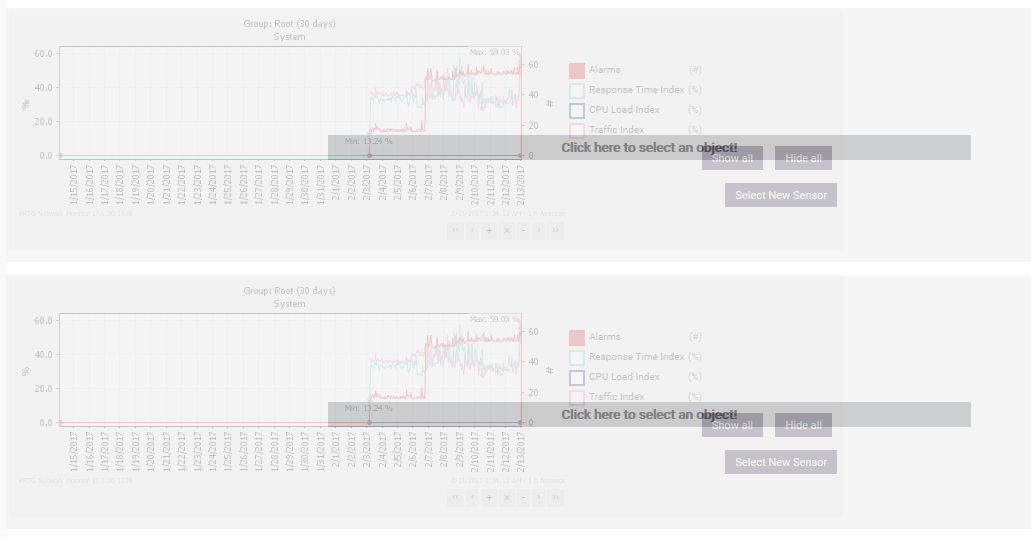
Select the objects that you want to show a graph for. Click the button Click here to select an object! to open the Object Selector. There are as many selection sections as you have defined before.

Select the Objects to be Compared
PRTG shows the graphs immediately after object selection. You can now cross-reference the graphs and adjust them as in the historic data tabs of sensors: select the channels that you want to display and zoom and scroll in the graphs. Click Select New Sensor to choose a different sensor for comparison.
If you want to create a sensor that combines data from various sensors, see the following sensor types:
Ajax Web Interface—Advanced Procedures—Topics
- Toplists
- Arrange Objects
- Clone Object
- Multi-Edit
- Create Device Template
- Show Dependencies
- Geo Maps
- Notifications
- Libraries
- Reports
- Maps
- Setup
Other Ajax Web Interface Sections