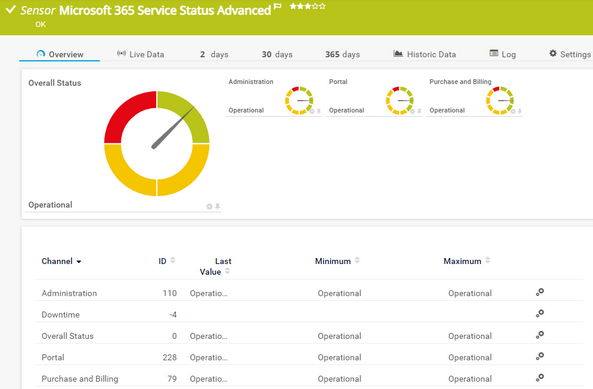
PRTG Manual: Microsoft 365 Service Status Advanced Sensor
The Microsoft 365 Service Status Advanced sensor monitors the detailed status of a service of a Microsoft 365 subscription.
For a detailed list and descriptions of the channels that this sensor can show, see section Channel List.
- Dutch: Microsoft 365 Servicestatus Geavanceerd
- French: Microsoft 365 statut de service avancé
- German: Microsoft 365 Dienststatus (Erweitert)
- Japanese: Microsoft 365 サービスステータス詳細
- Portuguese: Status do serviço do Microsoft 365 (Avançado)
- Russian: Подробные данные о состоянии службы Microsoft 365
- Simplified Chinese: Microsoft 365 服务状态高级
- Spanish: Estado del servicio de Microsoft 365 (avanzado)
Consider the following remarks and requirements for this sensor:
Remark |
Description |
|---|---|
Permission for the APIs |
This sensor requires permissions for Microsoft Graph.
|
Credentials |
This sensor requires credentials for Microsoft 365. |
IPv6 |
This sensor supports IPv6. |
Performance impact |
This sensor has a low performance impact. |
Lookups |
This sensor uses lookups to determine the status values of one or more channels. |
Scanning interval |
|
Knowledge Base |
Knowledge Base: How do I obtain credentials and set permissions for the Microsoft 365 Service Status sensors? |
The sensor has the following default tags that are automatically predefined in the sensor's settings when you add the sensor:
- microsoft365
- microsoft365sensor
For more information about basic sensor settings, see section Sensor Settings.
Setting |
Description |
|---|---|
Service |
The name of the Microsoft 365 service that this sensor monitors. |
Workload ID |
The Microsoft 365 Workload ID of the service that this sensor monitors. |
Setting |
Description |
|---|---|
API Request Retry |
Enter a number how often the sensor queries the Microsoft Graph if an API query returns no result before the sensor shows the Down status. Enter an integer. The default value is 3. The maximum value is 10. If you enter 0, the sensor does not retry to query the APIs. |
Setting |
Description |
|---|---|
Primary Channel |
Select a channel from the list to define it as the primary channel. In the device tree, PRTG displays the last value of the primary channel below the sensor's name. The available options depend on what channels are available for this sensor.
|
Graph Type |
Define how this sensor shows different channels:
|
Stack Unit |
This setting is only visible if you select Stack channels on top of each other above. Select a unit from the list. PRTG stacks all channels with this unit on top of each other. By default, you cannot exclude single channels from stacking if they use the selected unit. However, there is an advanced procedure to do so. |
Setting |
Description |
|---|---|
Result Handling |
Define what PRTG does with the sensor result:
|
By default, all of these settings are inherited from objects that are higher in the hierarchy. We recommend that you change them centrally in the root group settings if necessary. To change a setting for this object only, click ![]() under the corresponding setting name to disable the inheritance and to display its options.
under the corresponding setting name to disable the inheritance and to display its options.
For more information, see section Inheritance of Settings.
Which channels the sensor actually shows might depend on the target device, the available components, and the sensor setup.
Channel |
Description |
|---|---|
Downtime |
In the channel table on the Overview tab, this channel never shows any values. PRTG uses this channel in graphs and reports to show the amount of time in which the sensor was in the Down status |
Overall Status |
The overall services status
|
[Service] |
|
KNOWLEDGE BASE
How do I obtain credentials and set permissions for the Microsoft 365 Service Status sensors?
What security features does PRTG include?


