PRTG Network Monitor 9 Version History
Release Notes and Changes
To update your PRTG 9 installation use the "Auto-Update" feature: simply navigate to Setup | Auto Update in your installation. Or you can obtain the latest version from the PRTG download page!
Go to Download Page
Manual: Using the "Software Auto-Update" function of PRTG
May 9th 2012 - New Major Version 12
A new major version has been released.
Please go to Version 12 Release Notes to learn more
April 18th 2012 - Version 9.2.1.2307/2308
Note: If you update from version 8.x, please see the update notes in the PRTG 9 user manual.
- Changed: [Sensors] Improved SNMP engine
March 18th 2012 - Version 9.2.1.2279/2280
- Changed: [Probes] Improved remote probe software update process. Much faster probe updating after software update of the core server (especially for installations with many probes).
- Changed: [Sensors] Enhanced SNMP engine that especially improves SNMP V3 performance by up to a factor of 2-10 depending on intervals, SNMP request latencies, and number of sensors. CPU performance of the probe system is now the primary limiting factor to the number of SNMP V3 sensors that can be monitored by one probe.
- Bugfix: [Sensors] Incorrect warning/error limits in SQL sensors
- Bugfix: [Sensors] Fixes for SNMP V3
- Bugfix: [Sensors] Fixes for NetFlow 9 monitoring
- Bugfix: [Probe] Scheduled restart of local probe did not work properly
- Bugfix: [EC] Some URLs used password= instead of passhash=
- Bugfix: [EC] Fixed incorrect date/time sorting of log display
- New: [Sensors] Added “context name” for SNMP V3 monitoring
- Changed: [Licensing] Starter Edition now has 30 Sensors
- Changed: [Licensing] Updated license terms (clarifications for Corporate Edition license)
February 29th 2012 - Version 9.2.0.2235/2236
- New: [Core] Added Czech Translation
- Bugfix: [Core] In some cases WMI reconnections took up to one hour
- Bugfix: [Maps] Sometimes maps did not work on IE9
February 21st 2012 - Version 9.2.0.2195/2196
- Changed: Support for Google's new Maps API keys, which are shorter now
February 14th 2012 - Version 9.2.0.2175/2176
- Bugfix: [WebGUI] Breadcrumbs could display objects that were not accessible to the user
- Bugfix: [Maps] Map rotation did not work
- Bugfix: [Web Server] Fixed a potential script injection vulnerability
- Bugfix: [Sensors] The sensor "Thread: Context Switches/sec" provided by "WMI Vital System Data (V2)" did not work properly. Note: Existing sensors must be recreated.
- Various smaller bugfixes
January 24th 2012 - Version 9.2.0.2124/2125
- More than 400 changes since V9.1.6 released December 15th
- New: [Sensors] VMware 5 support
- ESX 5 and Virtual Center 5, and support for vApps
- New VMware sensors support ESX 4-5. Old sensors will keep working (not rewritten to new ones), but you cannot create the old ones anymore
- Note: Monitoring is currently limited to one thread at a time because of limitations of the VMware platform. Monitoring with VMware sensors is limited to about 30 sensors at 1 minute interval or 150 sensors at 5 minute interval (recommended)
- In case you reach these limits you can spread VMware sensors on different remote probes. See knowledge base article for details.
- Note: For VMware monitoring, the .NET 4.0 framework must be installed on the system running the PRTG probe (either the core server or the system running a remote probe)
- New: [Sensors] Chromium Based Full Page Sensor can now use the Chromium "WebKit" engine for monitoring (as alternative to the IE installed on the probe system)
- New: [Sensors] WMI UTC Time Sensor measures time difference between the system clock of a monitored device and the time of the PRTG system
- Changed: [WebGUI]: Two hands full of additional awesomeness for the AJAX WebGUI (various new features/improvements—see Blog article for details)
- Rewrite of the sensor selection for reports
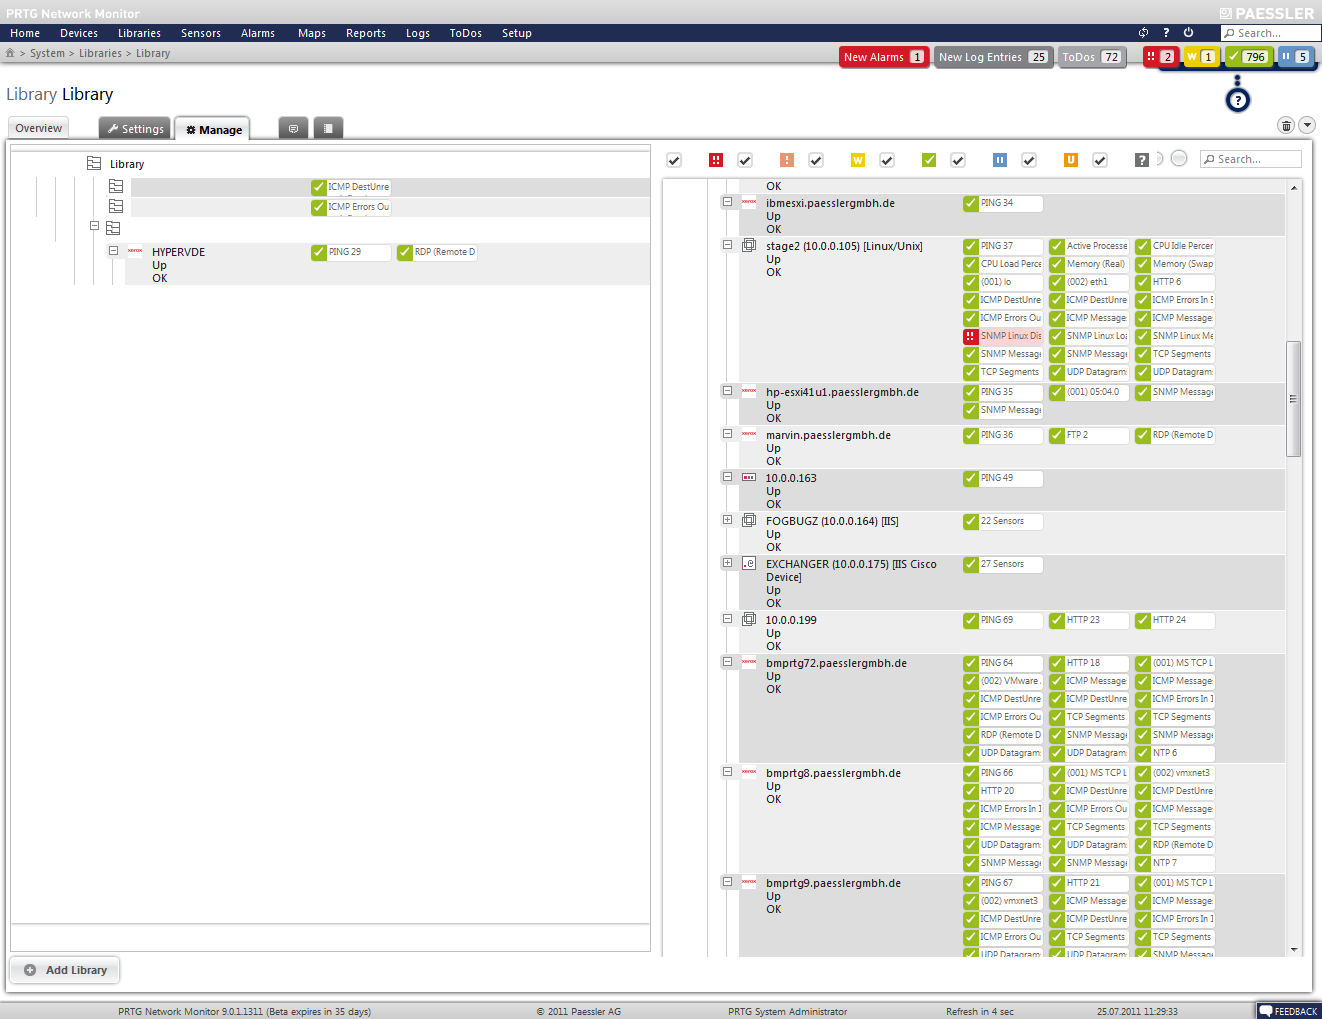
- Libraries can now be created with nested layers/groups
- Management tab optimized: now including multi-edit of object properties
- Faster Ajax Web GUI (speed optimized HTML/CSS)
- Official support for the new device tree views "sunburst" and "treeMap"
- Added a device tree navigation to the breadcrumbs
- Multi-edit for "Sensor Display" option (must select multiple sensors of one sensor kind)
- Display new version releases notes before auto-update is started
- You can now show/hide channels lines in graphs of sensors
- Rewritten page for "Setup | Downloads"
- Changed: [MobileGUI] Full rewrite of the Mobile Web GUI
- Optimized for iOS 3.2+, Android 2.1+/Honeycomb, Blackberry 6+, Windows Phone 7+, WebOS 1.4+, Meego, Kindle 3+, Firefox Mobile, Opera Mobile 11+
- Based on jQuery Mobile 1.0. Full list of supported platforms
- Changed: [EC] Extended functionality within the Enterprise Console
- Gets a "back"/"forward" button for viewpoints
- Setup functions are now available directly within the Enterprise Console window
- Changed: [Sensors] Improved handling of private keys for SSH sensors
- Changed: [Sensors] New DLLs for SQL database sensors
- Changed: [Sensors] Improved FTP Sensor (can now count only new files, too)
- Changed: [Sensors] QoS Round Trip sensor has a RTT (Round Trip Time) channel, Calculation for MOS Score corrected
- Changed: [Sensors] HTTP XML/REST Value Sensor now supports multiple name spaces in XML data
- Changed: [Core] Auto-Discovery can now work with (mixed) lists of DNS names and/or lists of IPs
- Changed: [Notifications] SMS messages can now be trimmed to 160 characters
- Changed: [Cluster] Improvements for the clustering code
- Bugfix: [Sensors] Scale Factor for various WMI Sensors corrected
- Bugfix: [EC] Fixed graph display for EXE/Script sensors
- Bugfixes: Various bugfixes and changes
December 15th 2011 - Version 9.1.6.1962/1963
Note: If you update from V8, please see the update notes in the PRTG 9 user manual.
- New: [WebGUI] Added a “Property Sheet” on the “Management” tab of groups/probes. You can now select one or more objects from the device tree and edit their settings in one place
- New: [Core] You can now allow “read-only users” to acknowledge alarms (this is an user account setting)
- New: [Core] You can now promote users of any PRTG user group to admins (this is an user group setting, if enabled all users of a group are admins). This means that you can now also manage PRTG admins in the Active Directory, too, by creating an AD based group in PRTG and giving this group admin rights. This option is available for all new user groups you create from now.
- New: [EC] Added “View Point” feature. When you start the EC you will be taken back to the same screen/tab/element that was viewed before the previous EC shutdown
- New: [WebGUI] Added new visualization for the device tree, see blog article for details
- Various bugfixes and minor changes, see knowledge base for details
November 28th 2011 - Version 9.1.5.1899/1900
- New: [WebGUI] Sensor cross reference is now available "by tag" and "by type"
- New: [Core] You can now create Active Directory groups with read-only users (only applies to new user accounts)
- Changed: [Maps] Map object „sizeable status icon on status related background” now works for all object types (probes, groups, devices, and sensors)
- Various bugfixes, see knowledge base for details
November 23rd 2011 - Version 9.1.4.1883/1884
- New: [Maps] You can now select a background color for a map
- New: [EC] One-click install of new software version if a core server runs a different version of the PRTG
- Changed: [Sensors] HTTP SSL Certificate sensor now uses proxy setting of device
- Changed: [Sensors] HTTP Advanced sensor now has a User Agent String setting
- Changed: [Sensors] Improved SQL sensors
- More changes and bugfixes, see knowledge base for details
November 15th 2011 - Version 9.1.4.1839/1840
- Improved: [Maps] All map objects can now have an associated link, you can either enter an external link or select a device tree object or a another map as link
- Improved: [Sensors] Improved connection handling for all WMI sensors, especially for WMI overload situations or whenever a target computer was rebooted
- Improved: [Sensors] Rewrite of the INI file sensor for improved connection handling and better rights management (you must create new INI file sensors to use the new engine, existing sensors stay untouched)
- Various improvements, changes and bugfixes, see knowledge base for details
October 20th 2011 - Version 9.1.3.1792/1793
- New: [Enterprise Console] Various improvements (speed and usability)
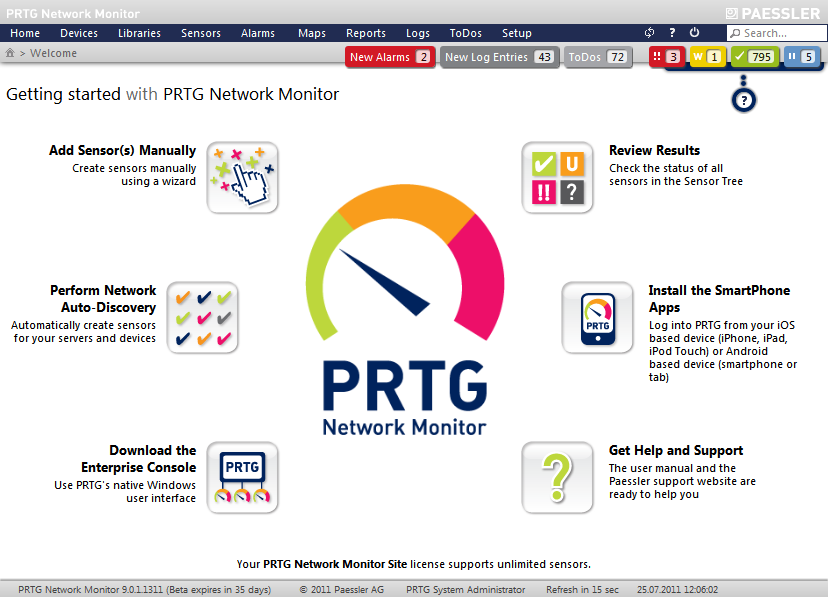
- New: [WebGUI] Redesigned startup screen
- New: [WebGUI] Alarmsound in browsers does not require Quicktime any more
- New: [Core] Active Directory integration now supports Universal Groups
- Various bugfixes, see knowledge base for details
October 11th 2011 - Version 9.1.2.1717/1718
- New: [Sensors] SNMP Traffic sensors can now use the “ifDescr” field as port identification (this is a new device setting)
- Various bugfixes, see knowledge base for details
October 6th 2011 - Version 9.1.1.1687/1688
- New: [Sensors] New sensor type “Windows Scheduled Task”
- New: [Maps] New map object resizable colored icon, see knowledge base
- Various bugfixes, see knowledge base for details
September 30th 2011 - Version 9.1.1.1644/1645
- Various bugfixes, see knowledge base for details
September 19th 2011 - Version 9.1.0.1527/1528 - New Major Version
Initial release of new major version 9. For detailed feature descriptions, please see the list below and look at blog article "What’s Cool in PRTG 9 - The CEO's Personal Top 10 List". See also PRTG 9 Manual: Update From Previous Versions to V9.
What's New in PRTG Network Monitor 9?
With PRTG version 9, we introduce a lot of new features that will bring network monitoring to a new level. Many of the new features are a response to requests from our user community, and there are some more cool features which we are sure you will love.
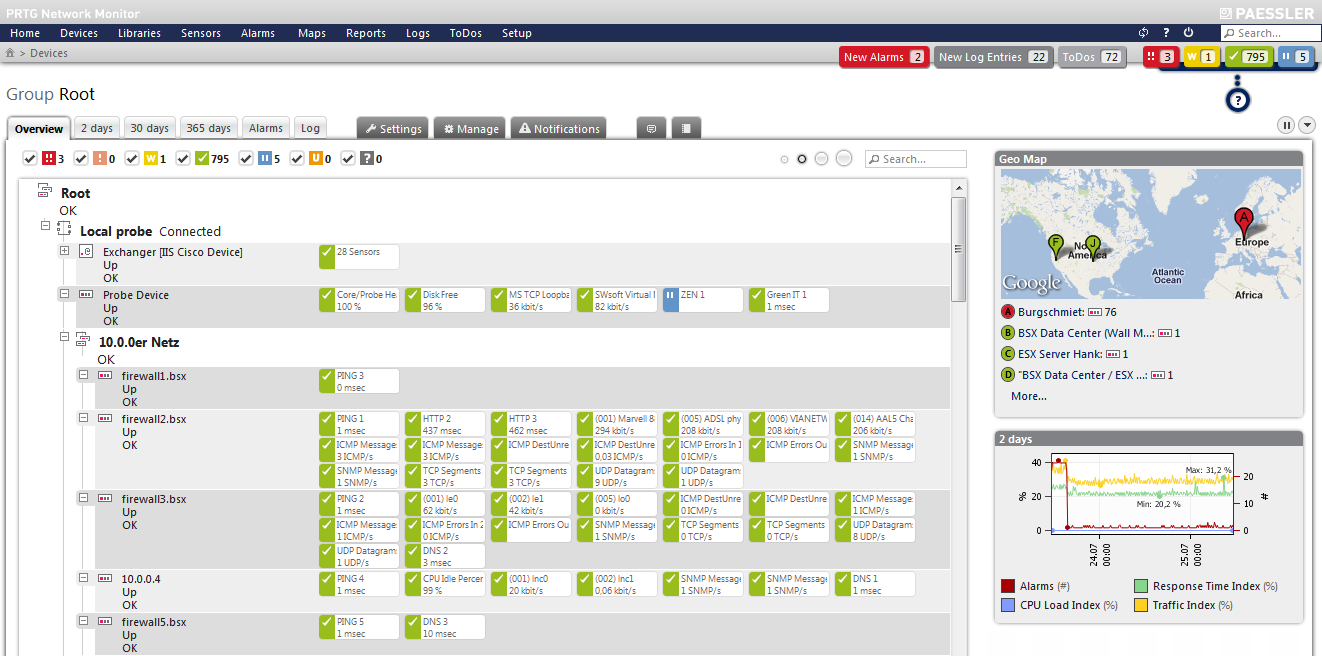
"Libraries" and Improved Tree Display
- Users can build their own "trees"
- Highly interactive tree display, e.g. monitoring objects in trees and libraries can be moved or cloned by drag&drop (use the "Manage" tab)
- Speed improvements for large installations
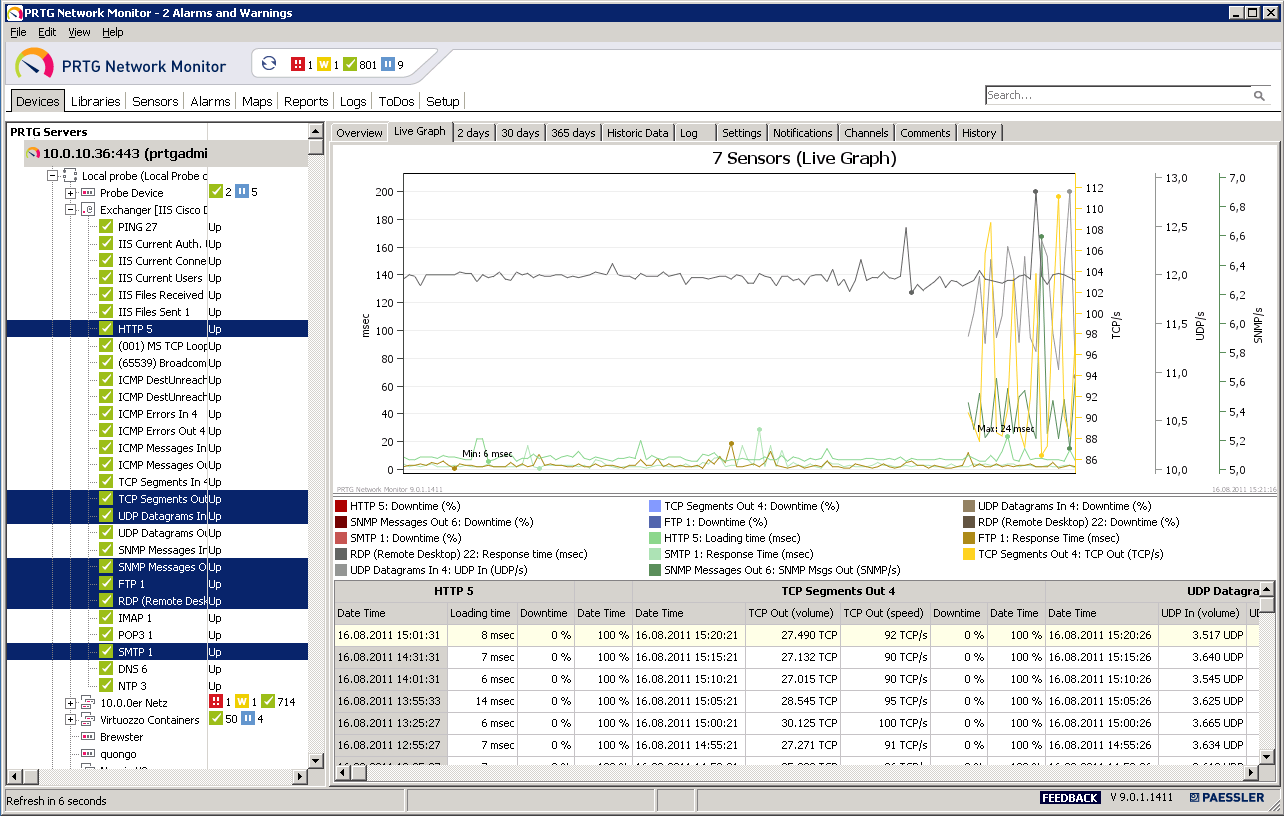
Our new "Enterprise Console"
Our former "Windows GUI" makes a big leap forward: The "Enterprise Console" now supports viewing data of multiple PRTG core installations at a glace: Your entire monitoring data in one single program, even in huge setup scenarios.
- Connects to one or several PRTG servers
- Displays aggregate information for all servers
- Enables the user to monitor virtually unlimited number of sensors by scaling "horizontally" (i.e. distributing sensors on many PRTG servers)
- Many new features inside, now supports almost all functionality of the Web GUI
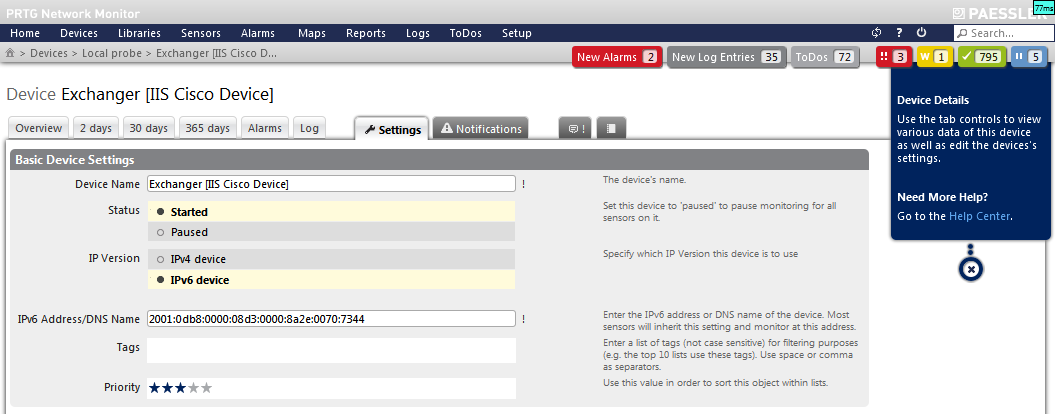
Monitoring of IPv6 Networks
IPv6 is becoming an important part of IT management. PRTG 9 supports monitoring IPv6 based networks:
- 70% of available sensor types support IPv6
- Among these sensor types are, for example, ICMP, SNMP, WMI, HTTP, and most TCP based sensors, and the Packet Sniffer sensor
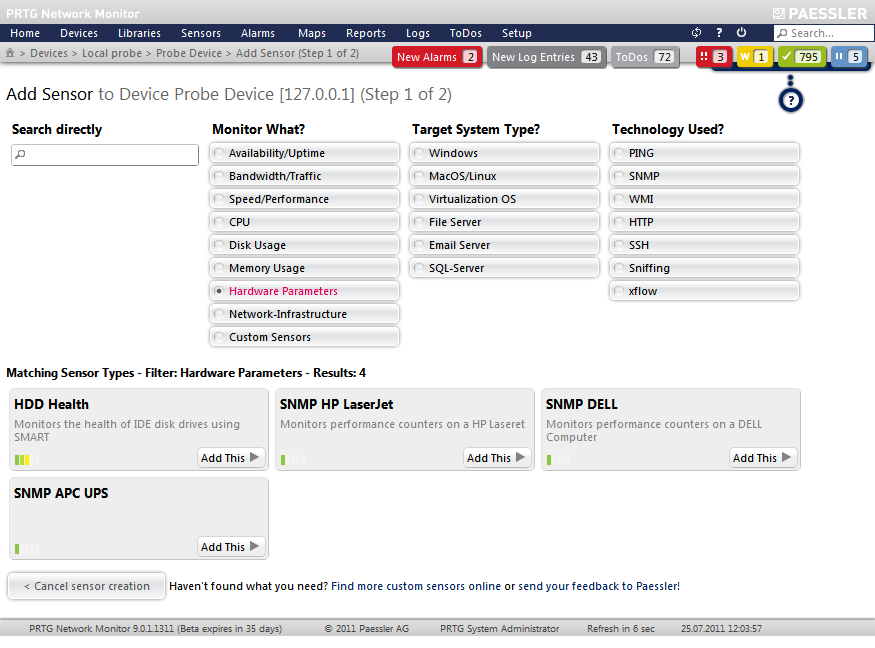
New "Add Sensor" Dialog and Added "Hardware" Sensor Types
This is the new user interface used for sensor type selection when you add new sensors manually. And we have added dedicated hardware sensors for selected vendors, e.g. Cisco, Dell, HP, APC, etc. as well as several new sensor types (see below).
New Monitoring Features
- New Two-Way QoS Sensor for "two way" monitoring (sends packets back and forth between two probes and measures QoS)
- QoS sensors now support DSCP/TOS setting to set QoS parameters inside the UDP test packets ("Traffic Control")
- Qos sensors now calculate MOS values
- New SSH ESX Disk Sensor for ESX/ESXi
- New WMI Physical Disk Sensor
- New WMI Hyper-V Virtual Network Adapter Sensor
- New SNMP String Sensor to monitor OIDs that return a string
- New Registry Sensor
- New WSUS Statistics Sensor
- New Health Sensors for Probe, Core, Cluster and System (monitoring internal status and status of the system that PRTG runs on)
- Rewrite of WMI Vital System Data Sensor
- DNS sensor now also supports other record types than "A"
- HTTP Advanced, Port, DNS and DHCP sensors can parse sensors results using regular expressions
- SSH sensors now support private keys
- Added a "Dependency Delay" feature
- "Percentage Channels": A channel of a sensor can now display the current measurement in percent of a given maximum value, e.g. the "link speed" of a port
- xFlow sensors now support sampling
- xFlow sensors can now distinguish packets from various devices sending flow data to the same IP/port ("sender-IP based flow analysis")
- New Packet Sniffer engine "WinPcap". This is the same engine on which the well-known "WireShark" system is based on
- Amazon SNS Notifications: PRTG can now send "Simple Notification Service" messages via Amazon
- More functionality for the Sensor Factory sensor type (including boolean functions)
User Interface Update
- The whole web interface got a "facelift"
- Rewrite of "Notifications trigger" editing
- Rewrite of "Sensor Selection" when creating new sensors
- Added Multi-Edit-function for sensor channel settings
- Rewrite of the "Welcome Assistant" (improved user guidance on initial setup)
- Rights report displays the user access rights for a monitoring objects and how these rights have been inherited from parent objects. Very useful for users that manage access rights in-depth
- New "Acknowledge Until" feature for Alarms acknowledgement for a certain period of time
- New "Pause Until" feature can pause a sensor for a certain period of time
- Update of AJAX functionality with speed improvements
- Support for "Desktop Notifications" with Google Chrome browser
- ...and many more
User Management using Active Directory
- Login accounts for PRTG users can be managed using Active Directory.
- This makes it much easier to manage large numbers of users that have access to the PRTG interface
Improved Cluster Functions
- Users can now access maps on all Cluster Nodes
- Map background images are automatically synchronized between nodes
- User can easily switch between cluster nodes (in Web interface and Maps)
- "Master Heartbeat": The current Master Node runs a script every 5 minutes that can e.g. change the IP address for access to the cluster in a DynDNS setup, to make sure the users will always be connected to the current Master Node.
Improved Auto-Discovery
- Added auto-discovery support for IPv6 (paste IP list)
- PRTG detects the vendor of devices by analyzing their MAC addresses
Automatic Software Update for Your PRTG Servers
- When a new version of PRTG is available, PRTG will automatically download the latest version and will notify you about the update
- Now you can click a link and PRTG will update itself automatically
- Automatic update is available for all trial and freeware users and for all commercial licenses with an active maintenance contract
July 14th 2011 - Version 8.4.2.2380/2381 - Final Build of Version 8
- Please see PRTG version 8 release notes for previous changes
