![]()
How to monitor syslog and SNMP trap messages in 6 steps
Syslog is a standard for system message logging. Many network devices support the syslog standard for use in network management and security audits or to send, for example, messages for analytical or debugging purposes.
SNMP traps are asynchronous notifications from network devices that support SNMP. These notifications are triggered to report important incidents such as system events, outages, or other critical issues.
You can deploy PRTG Network Monitor as a kind of syslog server and SNMP trap receiver by using the respective native sensors: the Syslog Receiver sensor and the SNMP Trap Receiver sensor. In this how-to guide, we will provide you with an example of how to set up syslog and SNMP trap message monitoring.
Performance considerations
Before you start to set up Syslog Receiver and SNMP Trap Receiver sensors, consider the following:
- The number of syslog and SNMP trap messages that PRTG can process depends heavily on your configuration and system setup.
- To improve performance, you have the option to filter incoming syslog or SNMP trap messages by different parameters in the sensor settings. This way, PRTG only processes specific messages and deletes other data.
- If you add the Syslog Receiver or SNMP Trap Receiver sensors directly to a network device instead of, for example, the probe device, their speed increases even more in comparison to specific filter rules.
- PRTG stores processed syslog and SNMP trap messages in an internal, highly performant database on the probe system. The main limiting factor for message storage is the hard disk space on the probe system.
- If you distribute the Syslog Receiver or SNMP Trap Receiver sensors over different probes, the overall performance becomes even more scalable. You also have more flexibility with regards to the data storage location.
How to set up syslog or SNMP trap messages monitoring
- To receive all syslog or SNMP trap messages from the probe system, add the respective sensors to the probe device. You can also add the sensors directly to a device in PRTG if you only want to process messages from this device.
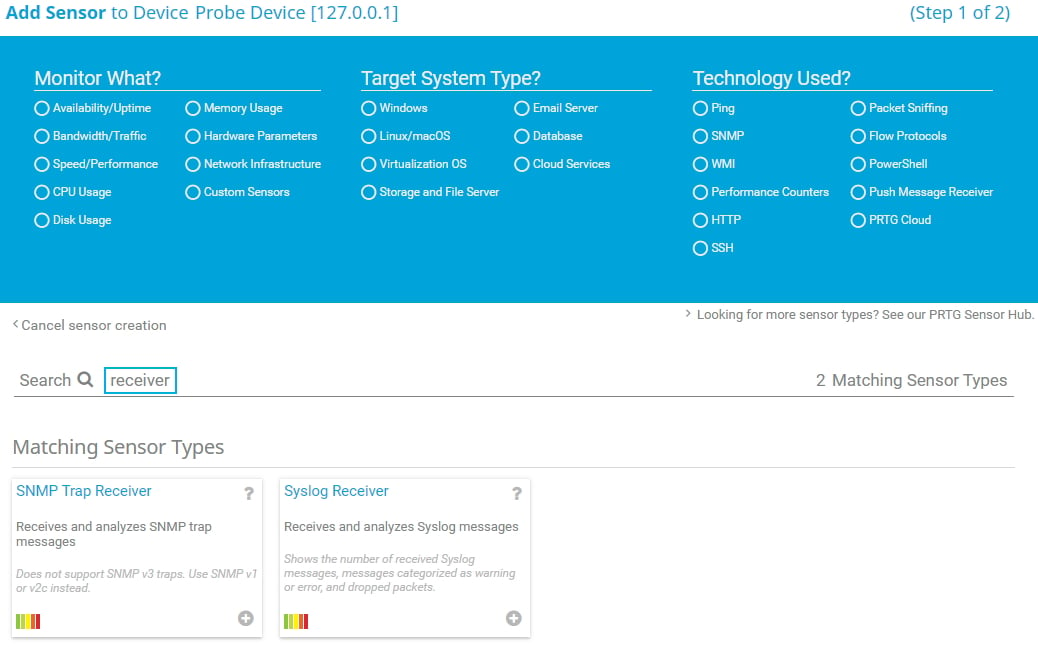
To do so, right-click the respective device and select Add sensor from the context menu. Then enter receiver in the Search field. If you add the sensors to a different device than the probe device, make sure that the IP address or DNS name that you provide in PRTG points directly to the sender of the syslog or SNMP trap messages. For example, if you want to receive syslog or SNMP trap messages from a storage area network (SAN), you need to add a device in PRTG that uses the IP address of the specific array member that sends the messages. Providing an IP address or DNS name that points to the entire SAN might not work.
 - Click the sensor that you want to add. Choose between SNMP Trap Receiver and Syslog Receiver. For this example, we use the Syslog Receiver sensor but the steps are the same for the SNMP Trap Receiver sensor.
- For the first configuration, leave the default settings and filters to see what data PRTG actually receives.
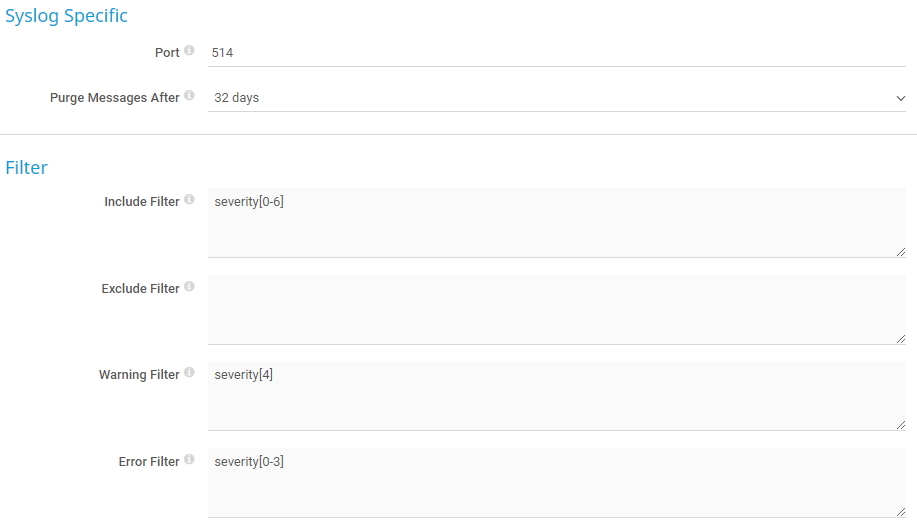
The default port on which PRTG listens for syslog messages is 514. The default port on which PRTG listens for SNMP traps messages is 162.
According to the default Filter settings of the Syslog Receiver sensor, the sensor shows the Warning status if there was at least one syslog message with severity 4 and the Down status if there was at least one message with severity 3 or lower during the last sensor scan. - Click Create to add the sensor. Because you have not yet configured your source device, PRTG receives no data and shows the Unknown status.
Before PRTG can start receiving syslog or SNMP trap messages, you need to configure the respective device that sends the messages to point to the matching sensors in PRTG. For the configuration, see the respective vendor documentation.
- Specify the IP address of the probe system where the Syslog Receiver or the SNMP Trap Receiver sensor runs.
- If you use the sensor’s default settings in PRTG, set port 514 for a device that sends syslog messages and port 162 for a device that sends SNMP trap messages.
- Choose UDP as protocol.
- Note that the SNMP Trap Receiver sensor does not support SNMP v3. Use SNMP v1 or v2c instead.
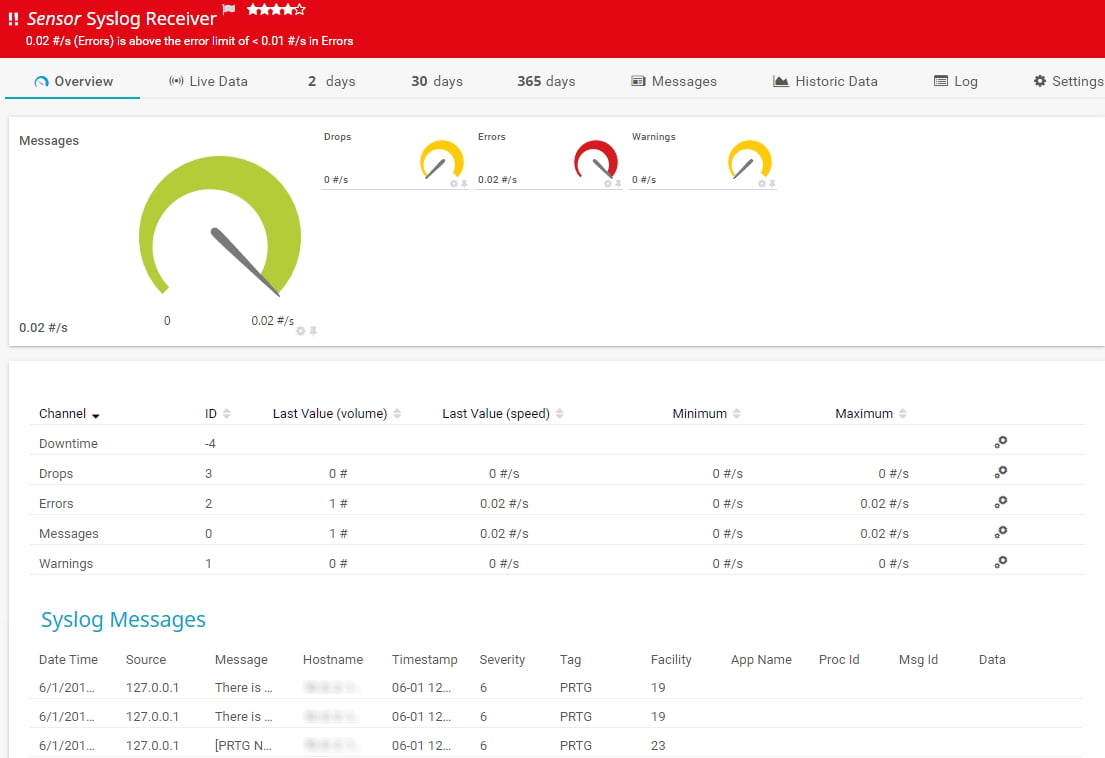
When the source device starts sending syslog or SNMP trap messages to the defined probe system, sent messages that match the Include Filter automatically appear in the PRTG web interface. You can find the messages on the respective sensor’s Overview tab in section Syslog Messages or SNMP Trap Messages, as well as on the sensor’s Messages tab.
During each scanning interval, PRTG counts the received syslog or SNMP trap messages and displays the number in the respective channels. The channels show the total number of received messages as well as the total number of dropped, error, and warning messages.
PRTG defines sensor states per sensor scan. This means that if the sensor receives a syslog or SNMP trap message that counts as an error, the sensor shows the Down status for one scanning interval. If no new error message appears during this scanning interval, the sensor shows the Up status again.
PRTG processes and stores all incoming syslog or SNMP trap messages that match the Include Filter setting. In this case, the default setting is severity[0-6] for the Syslog Receiver sensor and any for the SNMP Trap Receiver sensor.
You can find the received data in the \Syslog Database and the \Trap Database subfolders of the PRTG data directory. PRTG creates one data file per hour.
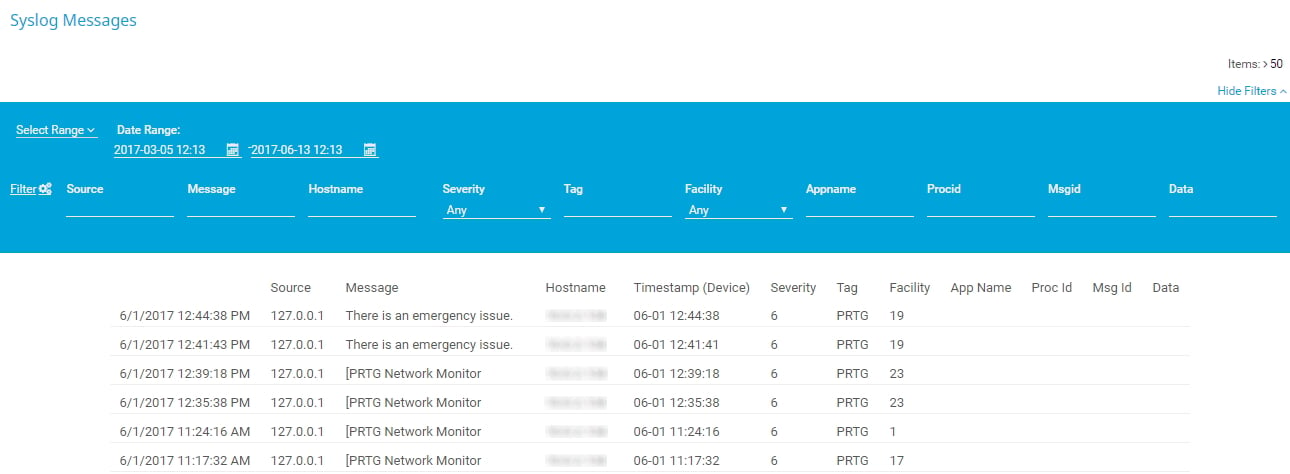
To review the received syslog or SNMP trap messages, navigate to the respective sensor’s Messages tab in the PRTG web interface. There, you can filter the messages by date and various other parameters.
Note: The parameters that you enter in the filter fields are case sensitive and must exactly match the parameters in the syslog or SNMP trap message.
![]() To make SNMP trap messages more comprehensible, you can add the MIB files of your devices to the \MIB subfolder of the PRTG program directory. This way, PRTG can resolve object identifiers (OID) to more understandable text. For example, the OID 1.3.6.1.4.1.32446.1.1.2 is displayed as SNMPv2-SMI-v1::enterprises.32446.1.1.2 = 0.
To make SNMP trap messages more comprehensible, you can add the MIB files of your devices to the \MIB subfolder of the PRTG program directory. This way, PRTG can resolve object identifiers (OID) to more understandable text. For example, the OID 1.3.6.1.4.1.32446.1.1.2 is displayed as SNMPv2-SMI-v1::enterprises.32446.1.1.2 = 0.
To improve the performance of your Syslog Receiver and SNMP Trap Receiver sensors and to only collect the data that you really need, you can adjust the message filters in the sensors’ settings.
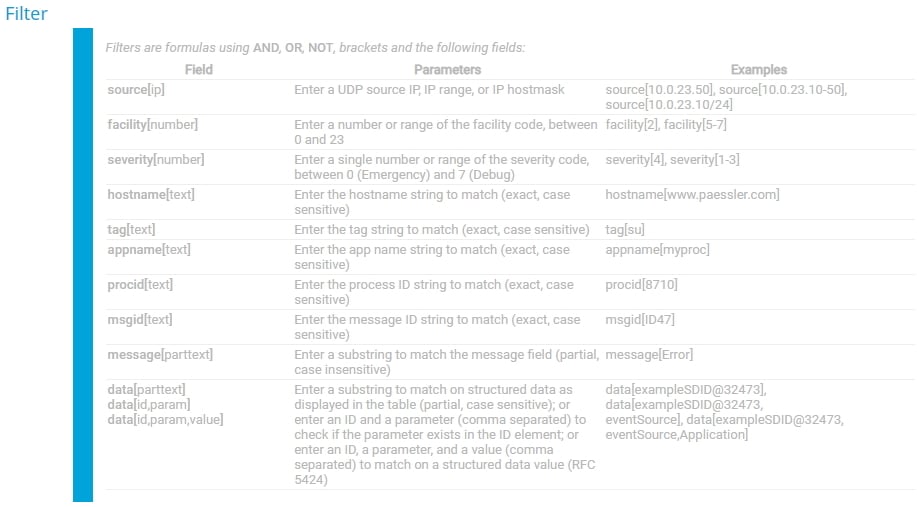
Navigate to the respective sensor’s Settings tab and use the provided filter rules in the Filters section to define the following filters:
- Include Filter: PRTG only processes and stores the specific types of messages that you enter here.
- Exclude Filter: PRTG does not process and store the specific types of messages that you enter here.
- Warning Filter: The rules that you enter here categorize the received messages as warnings and the sensor shows the Warning status.
- Error Filter: The rules that you enter here categorize the received messages as errors and the sensor shows the Down status.
The filter rules must have the correct syntax to work. For more information, see the filter rules for the Syslog Receiver sensor and the filter rules for the SNMP Trap Receiver sensor.
By default, the Warning and Error channels of the Syslog Receiver and the SNMP Trap Receiver sensor have a very low upper warning and error limit of 0.00000001. This way, only one syslog or SNMP trap message that counts as a warning or error message is enough for PRTG to show the Warning or the Down status.
If you want to get a notification when PRTG receives a warning or error message, best practice is to add one state trigger for the Down status and one state trigger for the Warning status to the respective sensor:
- Navigate to the sensor’s Notification Triggers
- Hover over the blue plus icon and click Add State Trigger.
- In the first line, enter 0 seconds for the time condition.
- Select the notification method of your choice.
- Adjust all other settings according to your needs.
- Click the blue check icon to save the notification trigger.
