White Paper: Application Monitoring (inglés)
Monitoring Applications and Services with Network Monitoring
Avoiding Cracks in the Foundation
Company productivity in today’s IT age is heavily dependent on the applications and services used within the company. For example, many companies use central (web) applications to organize internal workflows. Solutions like Microsoft SharePoint support project management or help to coordinate tasks. If a workflow service crashes, entire work processes grind to a halt. In order to use such collaboration platforms – and any important company applications – without interruption, permanent monitoring of the applications is advisable. The same goes for the company website. The digital figurehead is enormously important for successful marketing. Problems with the website can frustrate clients or even prevent them from making a purchase. Email systems, data backup solutions and Windows security updates are high up on the list of important applications and services as well. If all of these applications are running smoothly, they create a well-organized, solid foundation on which a company can function. To avoid cracks in this foundation, professional monitoring software can be used to monitor company applications so that factors like availability, bandwidth and general usage of the IT infrastructure are displayed transparently at all times.
Separate Monitoring for Applications and Services
Many monitoring solution providers offer bulk monitoring of application servers and services. Large-scale network monitoring is good - like basic ping and traffic monitoring on routers or switches with customized parameters - but often companies overlook individual aspects, such as the performance of important applications. Detailed monitoring of individual applications and services is more precise and reliable. Network monitoring solutions like the PRTG Network Monitor use preconfigured sensors to maintain a detailed overview of the status of each application separately.
Reliable operation of Sharepoint and IIS
These special sensor types provide detailed monitoring of various application and server processes. For example: the web application SharePoint serves companies as a collaboration platform for teams. The tool is used to manage projects, define responsibilities and coordinate work processes. Even SharePoint's content management functions help to accelerate daily work. In addition, many companies use the Windows server solution IIS to put up their websites, services and applications in the Net.
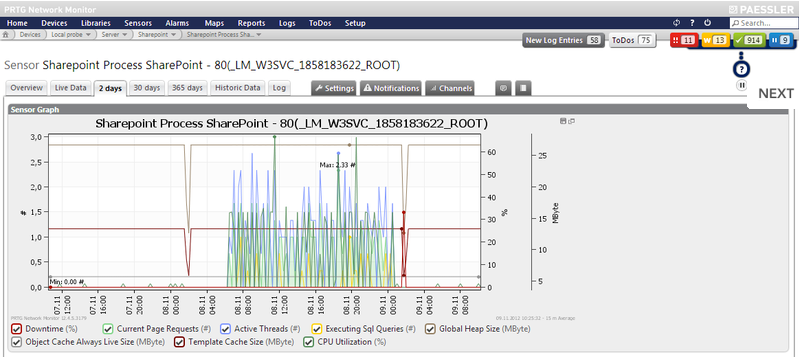
FIGURE: Detailed SharePoint process values
In order to ensure that IIS and SharePoint are always running reliably, the PRTG sensors monitor the seamless execution of various processes. The monitoring software provides the company's administrator with information regarding the number of page requests and
active threads, CPU usage or the number and response time of currently executed SQL queries in SharePoint. With IIS servers, the solution logs sent and received Bytes, the speed of GET and POST requests, the number of users per second, etc. Any delays or cra-
shes will be reported to the administrator immediately so that s/he can respond at once.
Keeping an eye on the website
Administrators want the same kind of reaction speed for incidents concerning the company website. The website is the company's digital display window, its way of presenting itself. A company's Internet presence and web shop (if the company has one) reflect its performance in the World Wide Web. Because of this, the availability of the website is crucial. Providers can lose customers if pages load too slowly or purchases in the web shop fail due to technical errors.
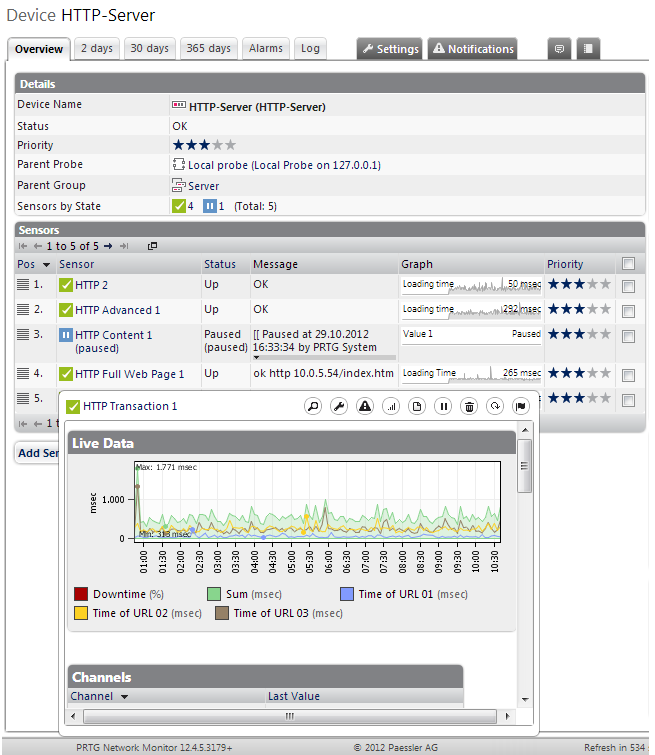
In order to avoid possible losses due to annoyed customers, the network monitoring solution reports any unusual website behavior immediately. In addition to the various HTTP sensors that check the website's availability and loading speed, PRTG Network Monitor also offers a so-called HTTP Full Web Page Sensor, for example, which checks the time of complete page downloads, including images, etc., and can even create a visual history of the page. The HTTP Transaction Sensor simulates transactions in the web shop and monitors their successful completion. An HTTP Apache ModStatus Totals Sensor is available as well, which checks how often a corresponding web server is accessed and the transferred data volumes. This helps to identify peak demand times, and the administrator can decide whether additional bandwidth is necessary.
FIGURE: There are several sensors for monitoring websites and services
Monitoring email systems
In (nearly) all companies, a functioning email system is nearly as important as website performance in regards to public image. If email communication with clients and business partners crashes, or even internally between staff and departments, productivity suffers.
This is why it is important for companies to keep an eye on their mail server. A professional monitoring system can monitor POP3, SMTP and IMAP mail servers with specialized sensors. Companies can thus guarantee that they are able to send and receive emails and that that this occurs without delays.
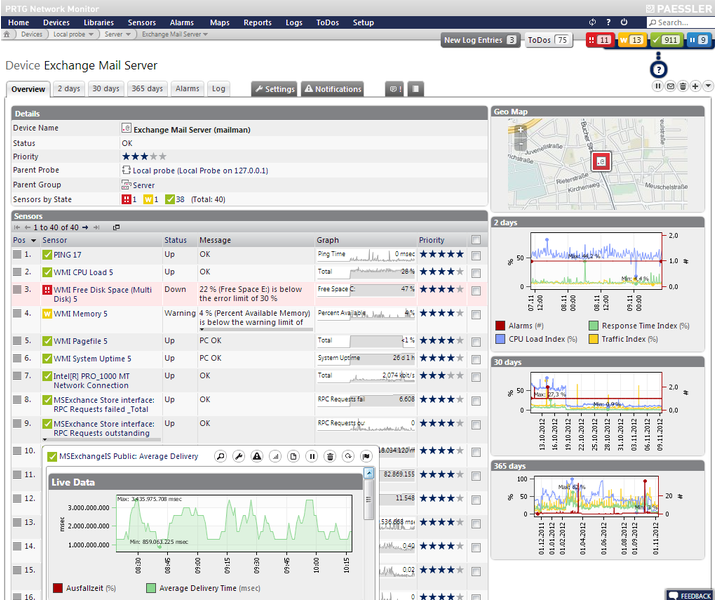
PRTG comprises standardized dedicated sensor types that are important for companies using the Windows Exchange server. These monitor mail queues, sending times and latencies and report changes in performance immediately. Sensors that show the backup status of an Exchange server, as well as information regarding the database, folders and email accounts are also available.
FIGURE: Monitoring an Exchange Server, including the different mail queues
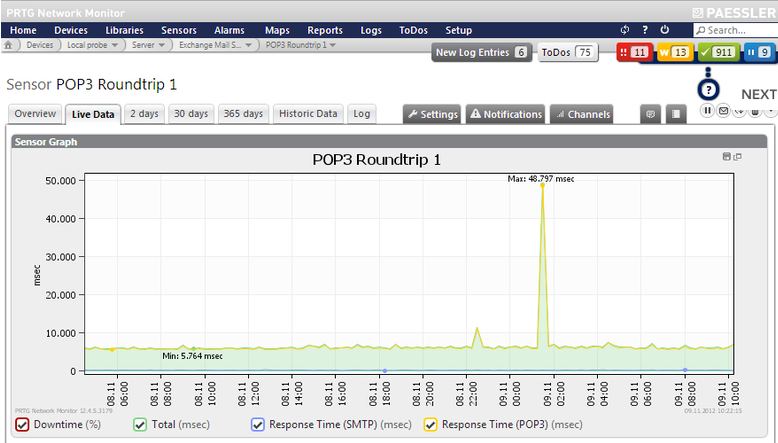
Two additional sensor types enable the so-called 'Email Round Trip Monitoring'. These record the time it takes for an email to be sent, received and resent to the initial server. To measure, the monitoring solution sends an email via SMTP to an external mail account. This account must be configured to forward the email directly to another email address on the company's mail server. After sending the test email, PRTG checks the corresponding inbox continuously via IMAP or POP3. As soon as the email is received, the monitoring software writes the 'round trip time' in its database. Companies are able to define limits for the round trip time. Exceeding these limits suggests slower or defective mail processes. In the worst case, this could indicate complete failure. In any case, the system notifies the administrator immediately.
FIGURE: Email round trip monitors the time necessary for email delivery
Backup monitoring
All types of data that are generated during daily business operations should be secured regularly, not just email accounts. Data backups contribute to reliable business operations. The IMAP sensors from PRTG are perfectly suited to monitoring these backups. The sensors can also monitor data storage on virtual machines, in the operating system, on an SQL server, etc.
FIGURE: Filter settings of the IMAP sensor monitoring backup
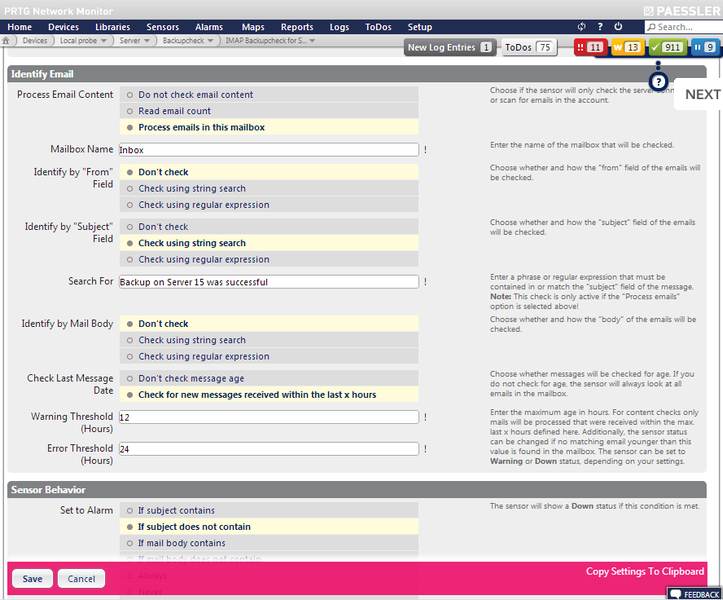
There are various backup solutions available for securing data. Many of these solutions can send emails that report the status of the nightly data backups. With this method, however, the administrator has to analyze multiple emails daily, in order to make sure that
all backups were completed successfully and that no problems arose. Alternatively, the IT department could set up their network monitoring software to analyze all emails in a certain account automatically using IMAP sensors. In other words, if all status emails are
sent to a single email address, the administrator can use the monitoring solution to keep an overview of all data backups. The administrator receives notification immediately if backups are not completed properly.
Overview of server and services
In addition to options for monitoring applications, various sensor types are available that have been specially designed to take care of Windows services. If errors occur here, sometimes the only way to solve the problem is to restart the service or the entire server.
If, for example, the administrator uses the network monitor to monitor the Windows services, s/he will receive a text message or email notification if a service crashes; however, the service will still need to be restarted manually.
Being able to restart the server or service would be more efficient. This is possible with PRTG's notification system. The administrator creates a script that can reboot single services or the entire server. If a service or server fails for a certain period of time, the monitoring executes the script by means of a special type of notification and the restart is executed automatically. The WMI service sensor (part of the standard PRTG package) can also be configured to restart Windows services.
Database performance checks
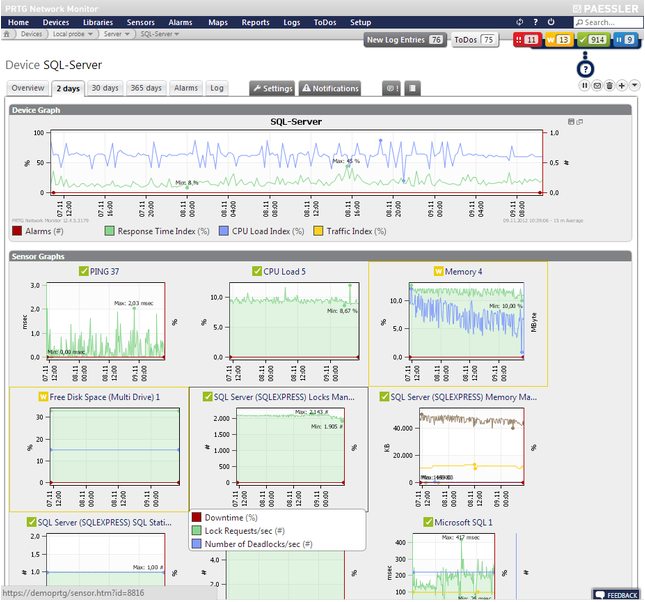
Database crashes in the company network are just as aggravating. In order to avoid database outages, and to make sure that all data are available for the staff at all times, the monitoring software continuously monitors the status of the database. If the performance fluctuates, the reasons for fluctuation must be determined. PRTG's WMI SQL Server sensors show, for example, the number of user connections. If the performance suffers at certain times, it may be that too many users are active at once. In this case, the administrator would be able to increase the available memory on the SQL server and solve the problem.
FIGURE: Performance statistics of a Microsoft SQL database
Visualizing Data
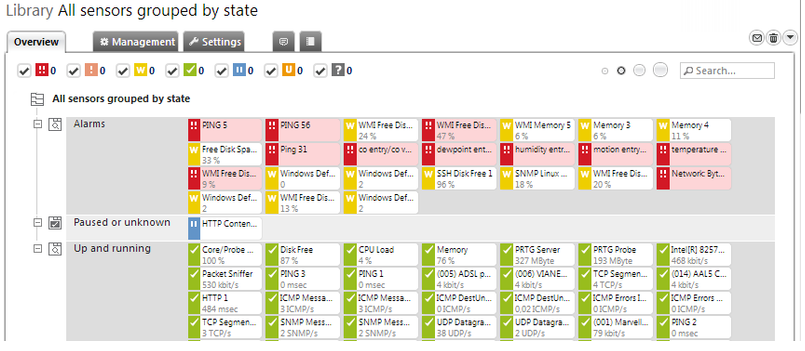
There are many different methods for visualizing the data gathered during monitoring. The data can be viewed directly in the PRTG device selection, for example. Here, all components monitored and sensors used are clearly displayed. Various display options are available to customize the display. Libraries in the software offer alternative customized views of the devices used. Filter options can be used to display lists of sensors that monitor dedicated applications or services collectively - independent of the device arrangement. Administrators can even select desired objects in the device selection, which are then automatically merged into a library by PRTG.
FIGURE: Library showing sensors by current status
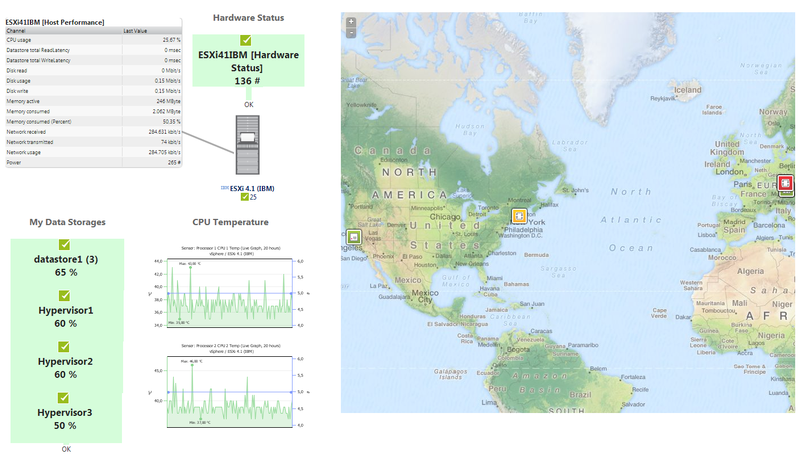
A more general and easier-to-read presentation mode is available in PRTG Maps. For example, the tool can display the live monitoring status, diagrams and tables for all application sensors. Classic reporting is available as well, which delivers regular reports - in PDF format, for example - that can be used for requirement analyses, management reports or for documentation of SLAs (Service Level Agreements).
FIGURE: Custom PRTG Map showing VM host hardware parameters
Conclusion
A network monitoring solution like PRTG is a central information point for all applications and services in the entire network. The monitoring software continuously monitors the performance of internal applications. Inconsistencies in the email system, on the
company's website, in data backups, in the database and all applications and services in the IT infrastructure are recognized and reported by the monitoring solution. In the event that a service is unavailable or a threshold is crossed, the software notifies the
responsible party immediately. This enables administrators to resolve inconsistencies before an outage occurs, and all applications and services run continuously and reliably.
