![]()
Supercharge your Windows performance with PRTG’s performance counter monitoring
- Identify & resolve Windows performance issues before they impact productivity
- Make informed decisions on system enhancements, upgrades, and resource allocation
- Ensure system security and compliance by identifying anomalies or vulnerabilities
Our users give top ratings for monitoring with Paessler PRTG


PRTG Windows performance counter monitoring:
What you’ll find on this page

PRTG makes Windows performance counter monitoring easy
Custom alerts and data visualization make it easy to monitor, identify, and prevent hardware, application, and service issues.
Elevate your Windows performance monitoring game
Ensuring your Windows Servers and applications are running smoothly isn’t just an IT task – it’s the backbone that keeps your digital world spinning. Enter Paessler PRTG’s Windows performance counter monitoring, your round-the-clock champion for keeping those critical systems in top shape.
Dive deep with detailed metrics in real time
Peek under the hood of your Windows infrastructure with the precision only PRTG can offer. Leveraging Windows performance counters, PRTG becomes the Sherlock Holmes of monitoring.
Deduct the health and performance of your system by analyzing everything from CPU load to memory usage. You get a comprehensive overview of your servers without the complications.
Custom alerts: The early bird catches the worm
Why wait for trouble to knock on your door? With PRTG’s customizable alerts, you’re the early bird. Set up your monitoring thresholds to fit the unique needs of your IT landscape.
Whether it's a spike in memory usage or a bandwidth bottleneck, PRTG sends you a nudge via email, SMS, push notification, and more, so you can act before it becomes a headache.
Keep it simple & smart with all-in-one monitoring
Embrace the simplicity of monitoring with PRTG. Instead of juggling multiple tools that barely talk to each other, get a comprehensive view of your IT environment.
PRTG slices through the complexity quickly, providing a seamless monitoring experience that covers all your hardware, services, and applications – on-premises or in the cloud – with zero fuss.
Secure and streamline your communications
With PRTG, your data’s security is non-negotiable. Rest easy knowing that communication between your PRTG server and monitored devices is encrypted and secure.
We use only top-tier encryption methods, ensuring that your data stays private and protected.
What Windows performance counter monitoring looks like in PRTG
Diagnose network issues by continuously monitoring your Windows machines with performance counters, WMI, SNMP, and more. Show Windows performance metrics in real time and visualize data in graphic maps & dashboards to identify problems more easily. Gain the visibility you need to troubleshoot your Windows systems.

Sunburst view of the complete monitoring setup

PerfCounter IIS Application Pool sensor in PRTG
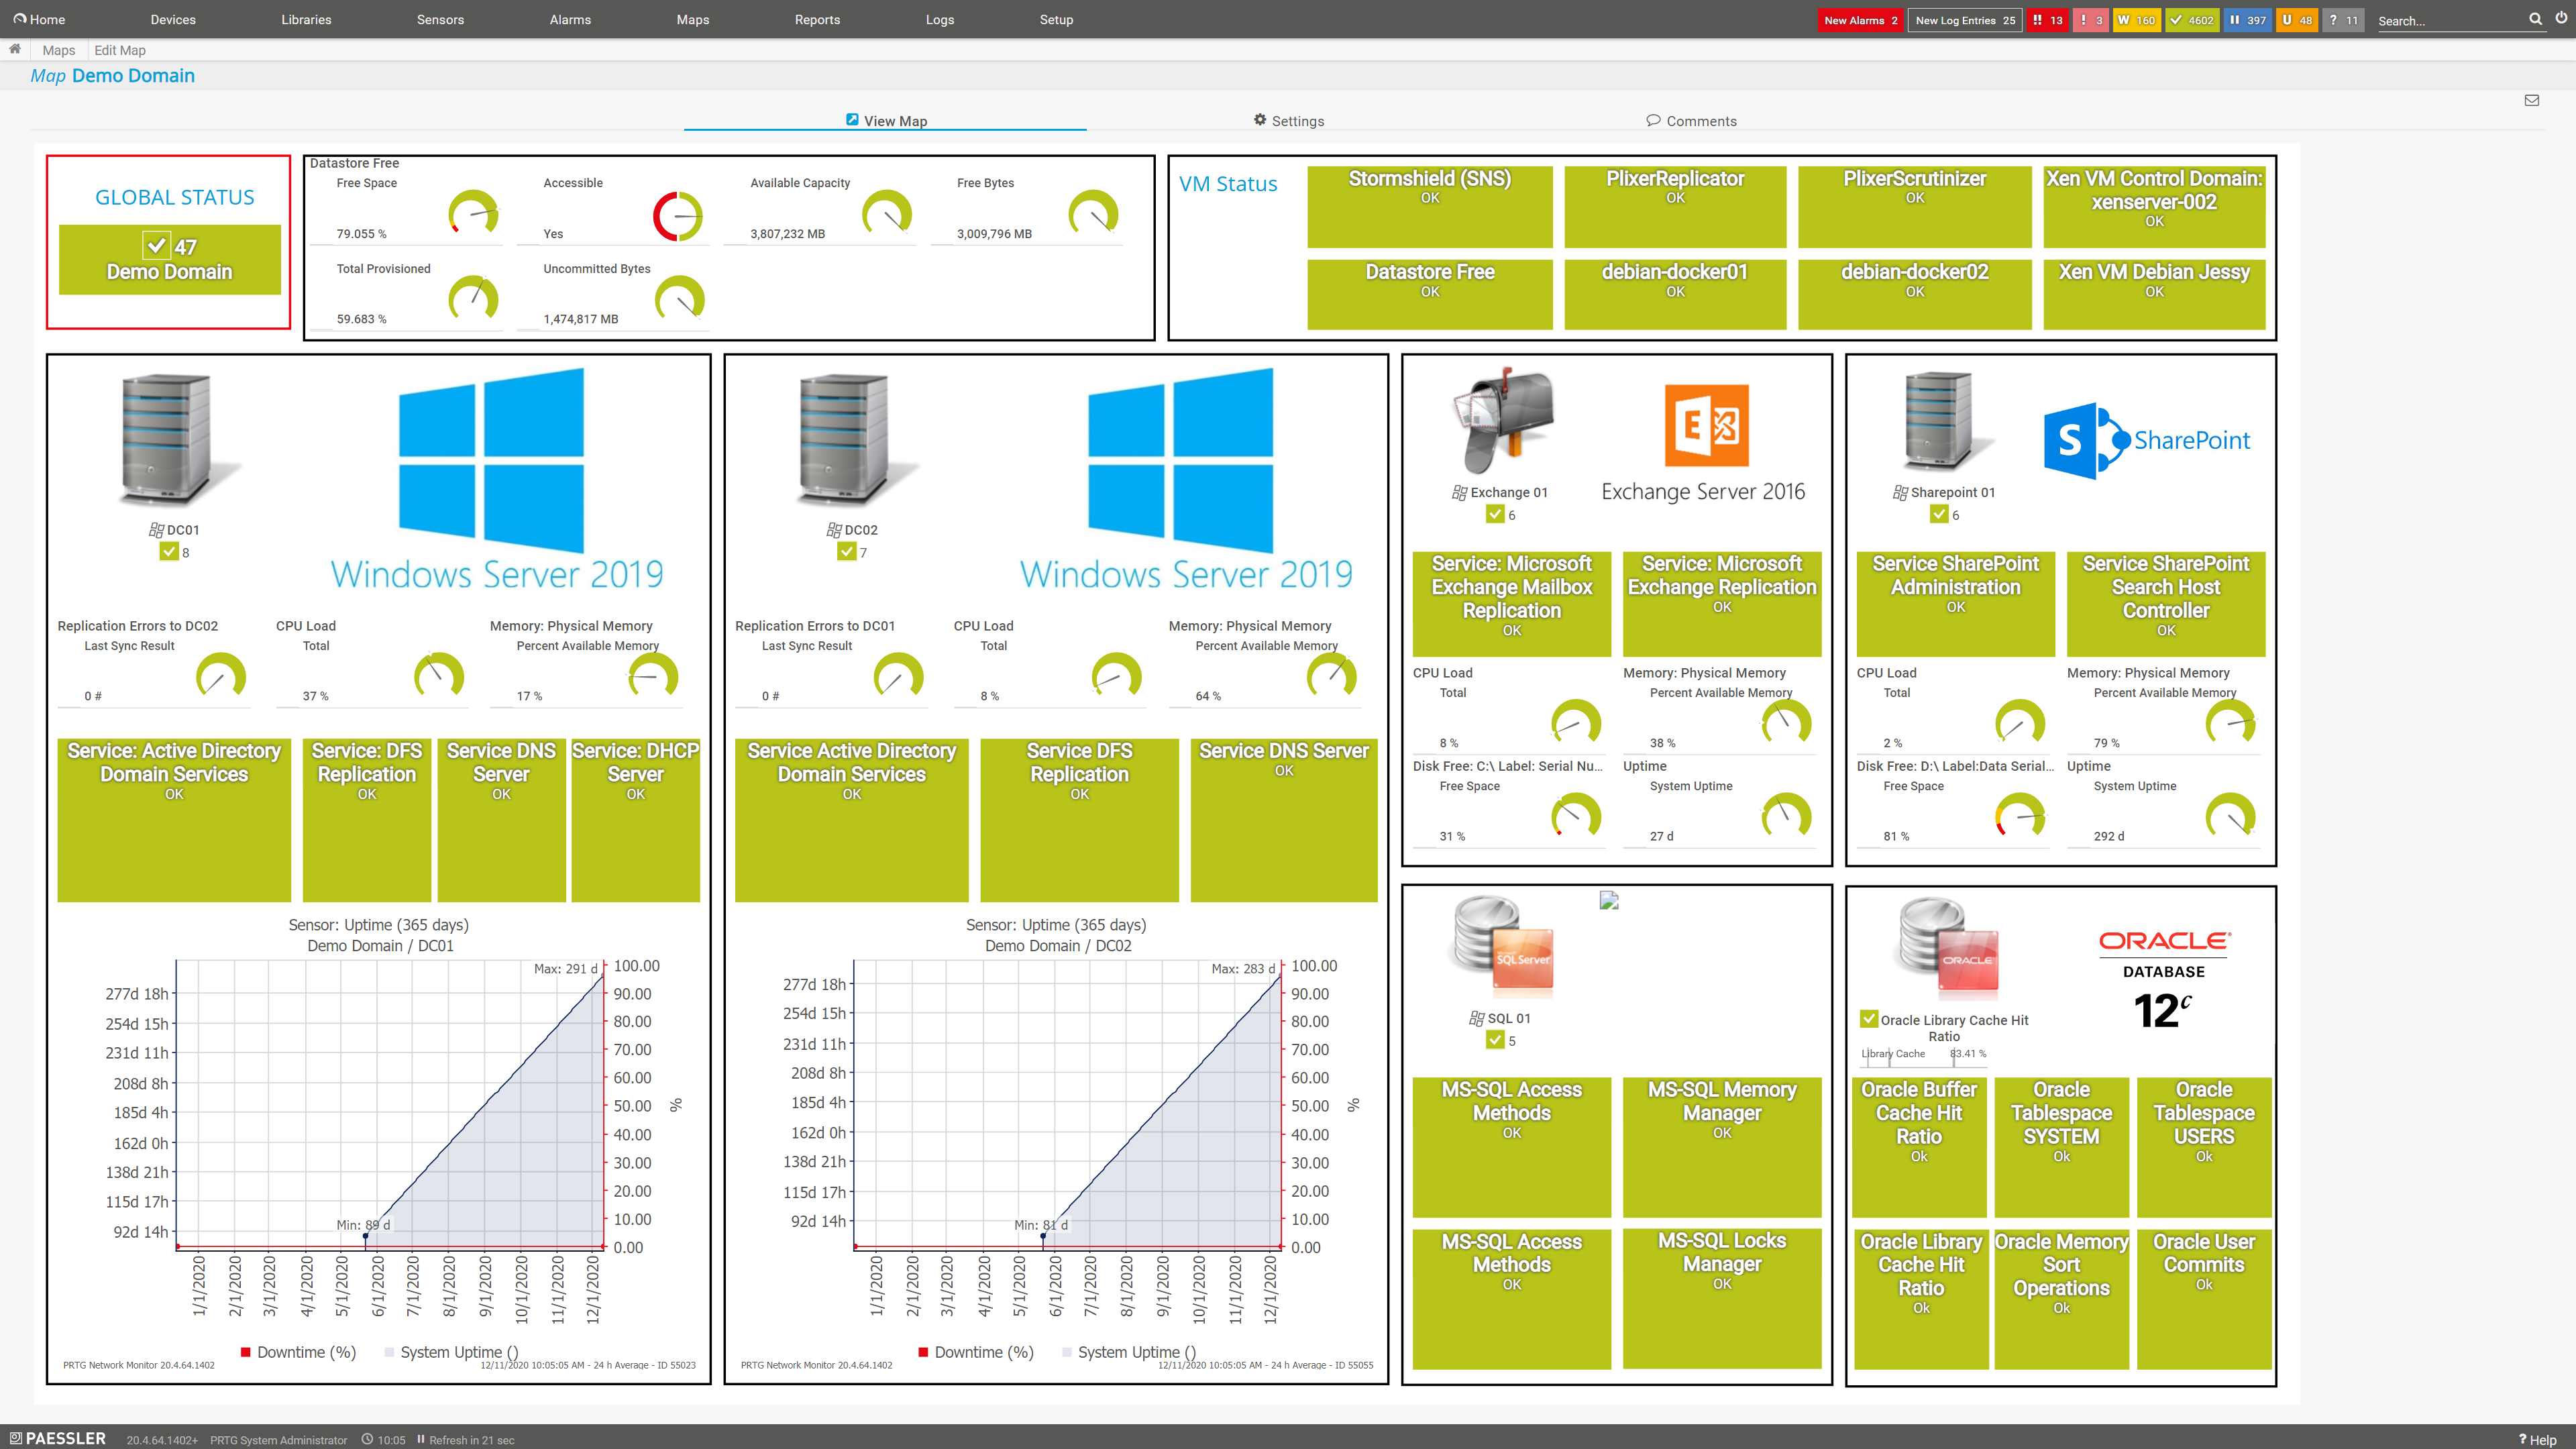
Custom PRTG dashboard for keeping an eye on the entire Windows domain
Start monitoring Windows performance with PRTG and see how it can make your network more reliable and your job easier.
“All-around winning “The real beauty of PRTG is the endless possibilities it offers” “Outstanding cloud IT experts agree: Paessler PRTG is a great solution for IT infrastructure monitoring

network monitor”

monitoring”
3 reasons to choose PRTG as your Windows performance monitoring tool
Comprehensive coverage
Monitor not just your Windows system and services, but also the performance of applications running on an IIS server, making sure nothing slips through the cracks. PRTG Windows performance monitoring gives you as much or as little detail as necessary.
Critical insights
Get the lowdown on important performance metrics like CPU usage, memory load, or processor time, and drill deeper to find out where the root cause of an issue lies – in the network, hardware, or application itself. PRTG is the high-tech crystal ball for your IT environment.
Real-time updates
Stay informed with live monitoring that keeps you in the loop, whether you’re in the office or making a midnight snack run. With PRTG’s alert system, you’re always the first to know when something’s amiss, allowing you to take action faster and proactively.
Get an overview of the following Windows performance data with preconfigured PRTG sensors
PerfCounter Custom
User-defined Windows performance counters for applications, services, and the OS with the PerfCounter Custom sensor
PerfCounter IIS Application Pool
Work process failures and status of an IIS application pool with the PerfCounter IIS Application Pool sensor
Windows IIS Application
Information on applications running on an IIS server such as SharePoint or SSRS with the Windows IIS Application sensor
Performance counters
Performance counters, for example on CPU load, disk queue length, Windows processes, and network card traffic
PRTG is compatible with all major vendors, products, and systems
![]()
Your Windows performance counter at a glance – even on the go
Set up PRTG in minutes and use it on almost any mobile device.


Easily find the source of the problem with our PRTG performance counter monitoring solution
Real-time alerts and custom notifications make it easy to solve issues with Windows application performance and system bottlenecks.
Create innovative solutions with Paessler’s partners
Partnering with innovative vendors, Paessler unleashes synergies to create
new and additional benefits for joined customers.


ScriptRunner
With ScriptRunner, Paessler integrates a powerful event automation platform into PRTG Network Monitor.
“Excellent tool for detailed monitoring. Alarms and notifications work greatly. Equipment addition is straight forward and server initial setup is very easy. ...feel safe to purchase it if you intend to monitor a large networking landscape.”
Infrastructure and Operations Engineer in the Communications Industry, firm size 10B - 30B USD
PRTG makes Windows performance counter monitoring easy
Custom alerts and data visualization make it easy to monitor, identify, and prevent hardware, application, and service issues.
Monitoring Windows performance counters: FAQ
What are Windows performance counters?
Performance counters are specialized tools within an operating system that collect and measure data about the system’s performance. In the context of Windows, performance counters track a wide array of system and application metrics, such as CPU usage, disk I/O, memory usage, network activity, and more.
This data provides valuable insights into how well the system and its components are functioning, helping identify bottlenecks, inefficiencies, or potential issues before they escalate. Essentially, performance counters serve as the pulse check for your IT environment, offering a real-time glimpse into the health and performance of your Windows systems.
What is the preferred technology for monitoring Windows performance with PRTG?
There are a few good reasons for using performance counters as monitoring technology for Windows Server: WMI, Microsoft's default method for monitoring Windows systems, uses an excessive amount of network resources and is sometimes unstable.
PRTG offers so-called "hybrid sensors" by default, which first attempt to request the desired data (such as CPU load) via performance counters, and only resort to WMI if performance counters are unavailable or cannot be read for some other reason.
From the point of view of performance, SNMP is definitely our top choice for monitoring Windows devices, but in certain cases this monitoring technology is inappropriate. Some data is simply not available on Windows machines via SNMP; in such cases, performance counters are often the better bet.
Why should I monitor Windows performance counters with PRTG?
All performance counters built into Windows are fully supported by PRTG. Take a look at your Windows Performance Monitor as described in our Knowledge Base article: Sometimes it's incredible to think of just how many performance counters there are for Windows apps! These also include those which do not come from Microsoft itself, for such counters often provide surprising insights into applications and processes.
Does PRTG only monitor basic Windows metrics?
No way! PRTG dives deep, offering detailed insights into a wide range of performance counters delivered by Window’s own performance monitor (perfmon.exe). Whether it's for a server, application, or hardware component, if Windows can track it, PRTG can monitor it.
Will PRTG alert me if there’s an issue with my Windows performance?
Yes, indeed. PRTG doesn’t just keep an eye on things; it also gives you a heads-up with customizable alerts. Keep your Windows servers and applications performing like a well-oiled machine with PRTG’s Windows performance counter monitoring. It’s the smarter, simpler way to ensure your IT infrastructure is surviving and thriving.
What is a sensor in PRTG?
In PRTG, “sensors” are the basic monitoring elements. One sensor usually monitors one measured value in your network, for example the traffic of a switch port, the CPU load of a server, or the free space on a disk drive.
On average, you need about 5-10 sensors per device or one sensor per switch port.

PRTG: The multi-tool for sysadmins
Adapt PRTG individually and dynamically to your needs and rely on a strong API:- HTTP API: Access monitoring data and manipulate monitoring objects via HTTP requests
- Custom sensors: Create your own PRTG sensors for customized monitoring
- Custom notifications: Create your own notifications and send action triggers to external systems
- REST Custom sensor: Monitor almost everything that provides data in XML or JSON format
More than just a monitoring tool:
Reasons our customers love PRTG


Paessler PRTG is used by companies of all sizes. Sysadmins love PRTG because it makes their job a whole lot easier. Bandwidth, servers, virtual environments, websites, VoIP services – PRTG keeps an eye on your entire network. Everyone has different monitoring needs. That’s why we let you try PRTG for free.Still not convinced?
![]()
More than 500,000
sysadmins love PRTG![]()
Monitor your entire IT infrastructure
![]()
Try Paessler PRTG
for free
![]()
Start monitoring Windows performance with PRTG and see how it can make your network more reliable and your job easier.
|
PRTG |
Network Monitoring Software - Version 24.2.94.1424 (May 2nd, 2024) |
|
Hosting |
Download for Windows and cloud-based version PRTG Hosted Monitor available |
Languages |
English, German, Spanish, French, Portuguese, Dutch, Russian, Japanese, and Simplified Chinese |
Pricing |
Up to 100 sensors for free (Price List) |
Unified Monitoring |
Network devices, bandwidth, servers, applications, virtual environments, remote systems, IoT, and more |
Supported Vendors & Applications |
|